Introduction
Geopandas is a python packages for GIS (geographic information system). The package helps perform sophisticated spatial temporal analysis. Very often, we visual the findings on maps. A simple application I am going to show you here is to visualize the global equity market valuations, yield, and structure. Despite its simplicity, the maps show interesting emerging patterns across Europe, America, Asia, and Africa.
Up-to-date market information can be expensive. I am not aware of any free database that provides information on individual company’s earnings, share prices, book value across the global equity markets. This is a daunting task for an amateur who has no access to paid institutional or research databases. I have found a way to partially get around the need for subscription. The idea is to study ETF factsheet or prospectus carefully to extract information on equity markets. ETF (exchange traded fund) comes in many shapes and forms. The ones I pick are passive market index funds investing in major indices of different countries. These indices constitute companies that are most liquid and tradable. While the indices themselves are not the full representation of the entire market, they cover large-cap companies that are often heavily weighted in their markets. Even though the ETF issuers are supposed to update the factsheet or prospectus whenever changes occur, the information I can get from the site can be as old as last week. Anyway, the representation from such sampling should be good enough for a part-time project.
‘ishares’ issues a number of products targeting Asia, Europe and America equities markets. To obtain the country-level graduality, I choose 41 of their ETFs, each investing fund on its respective country. The websites of all of the 41 can be found in the References section.
Prerequisite
Install Geopandas and all dependencies
Methods
Downloading data from ishares
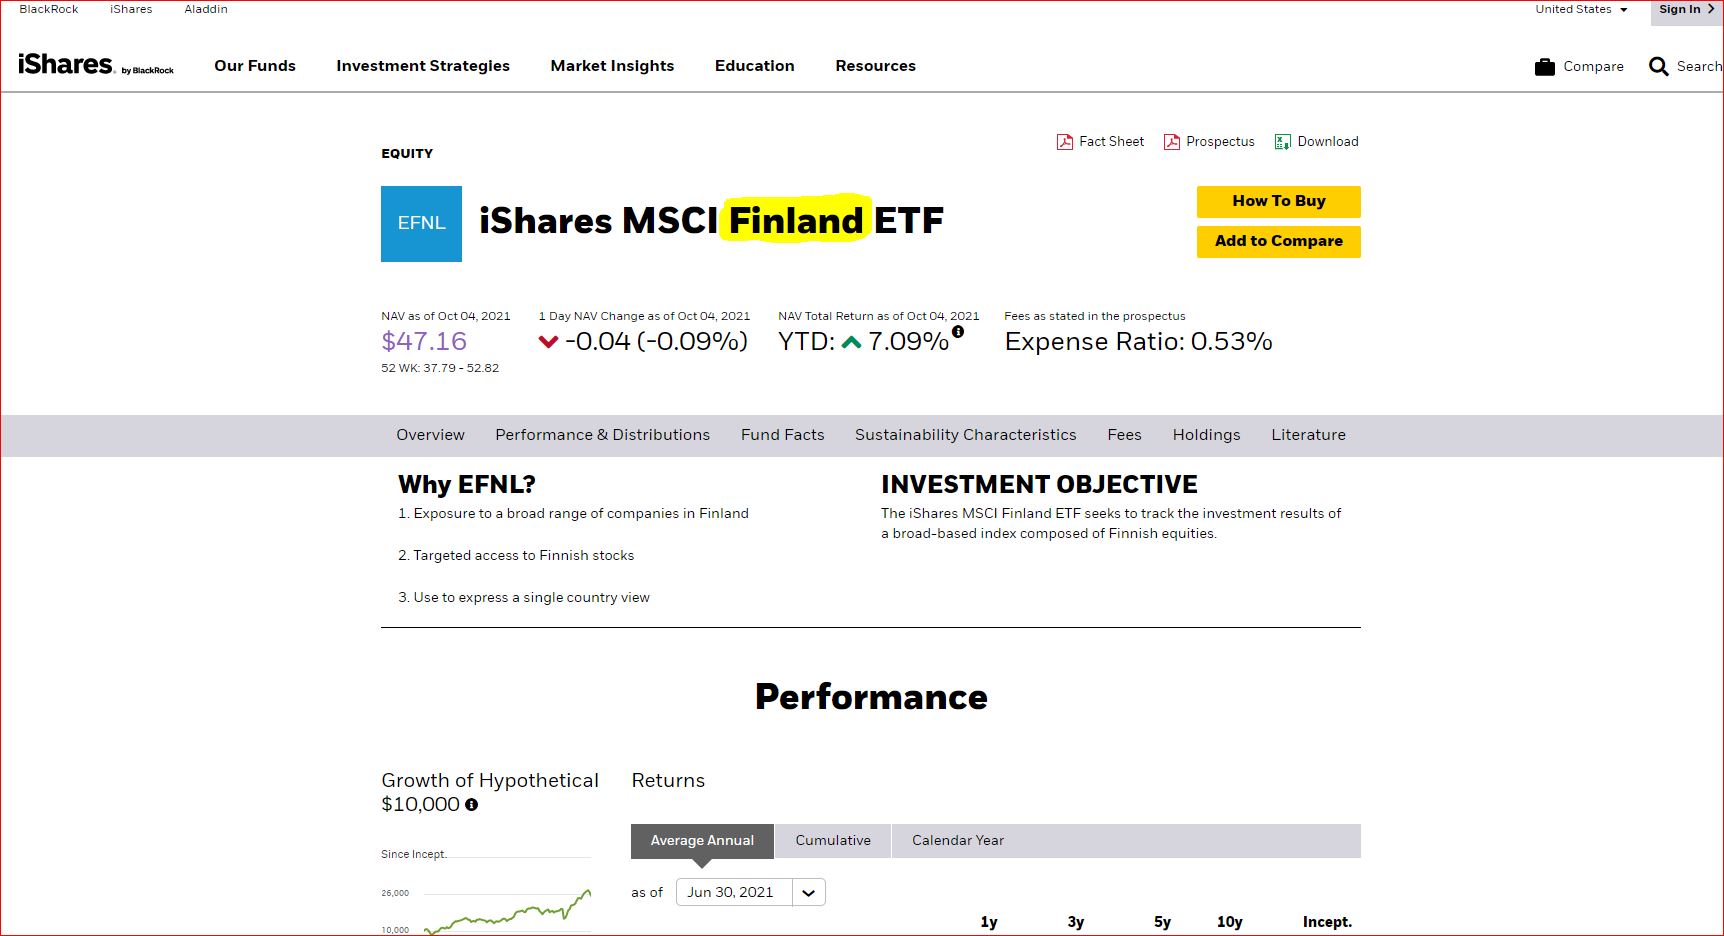
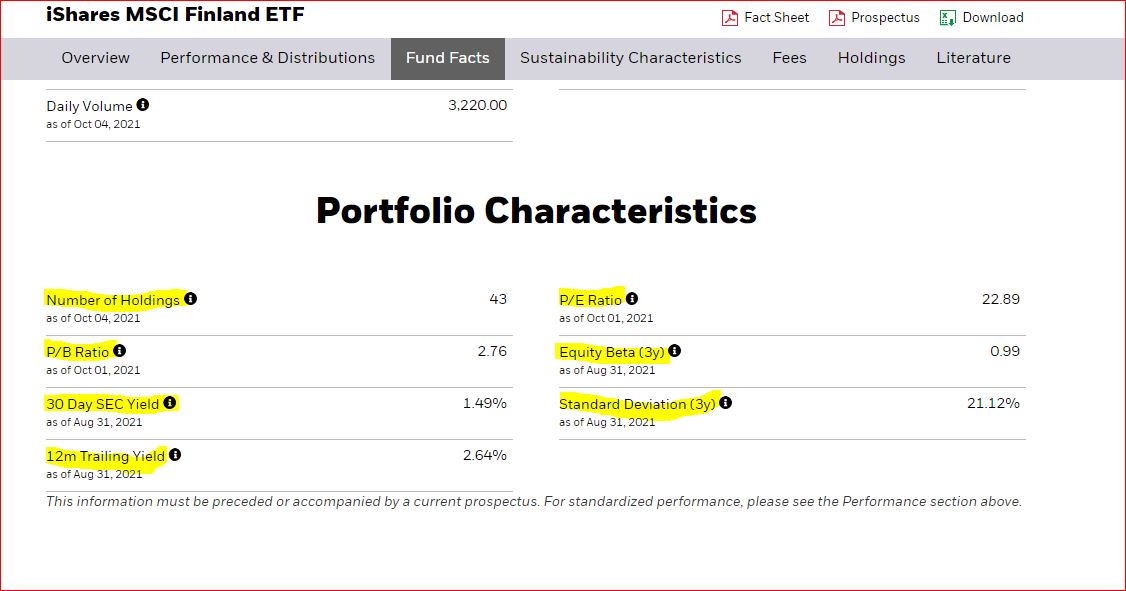
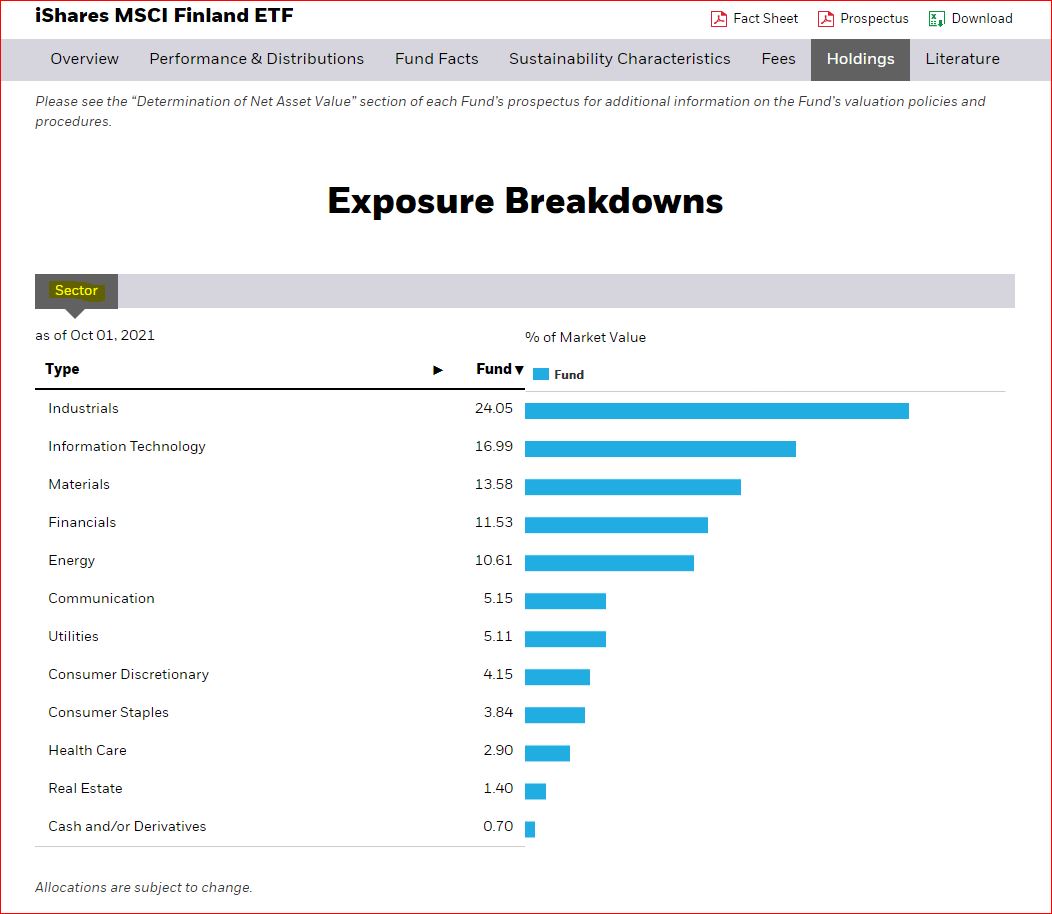
Automatic website parsing is possible on Ishares websites. I downloaded the html from the ETF’s URLs, parsed entries on the fund characteristics, and wrote the values to a csv file for later plotting. The steps were repeated for each country ETF. The structure of the data is best shown by the screenshots of the website table.
This is an ETF for Finland
The fund’s characteristics, which is used to infer the country’s equity market, are listed in the table below.
The sectors or industries these companies belong:
Data Visualization
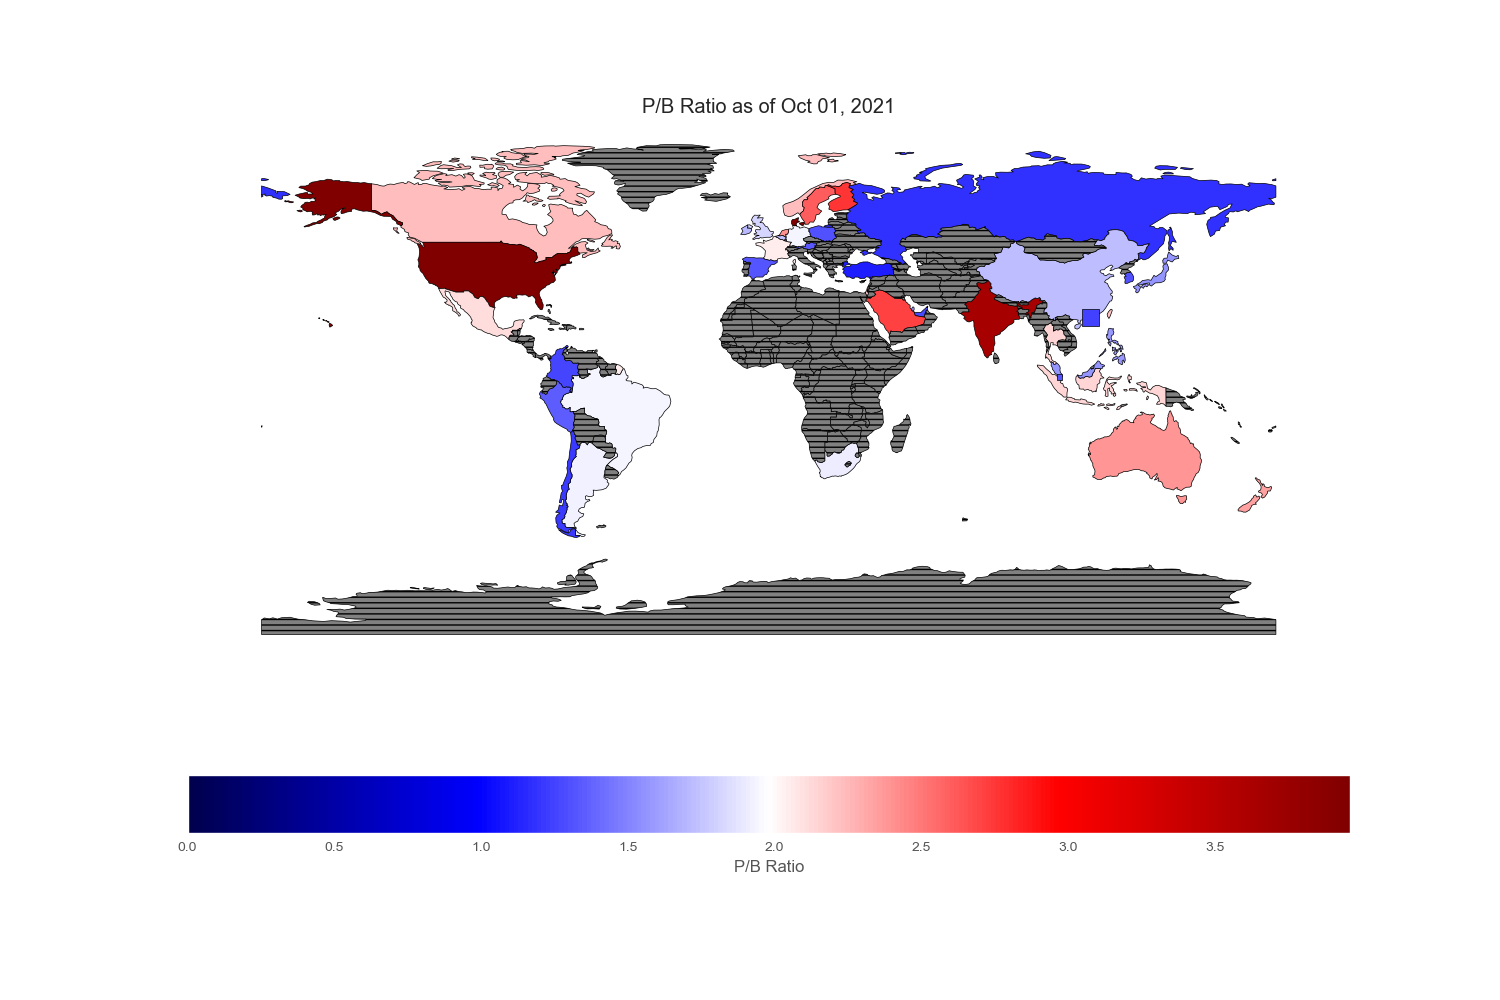
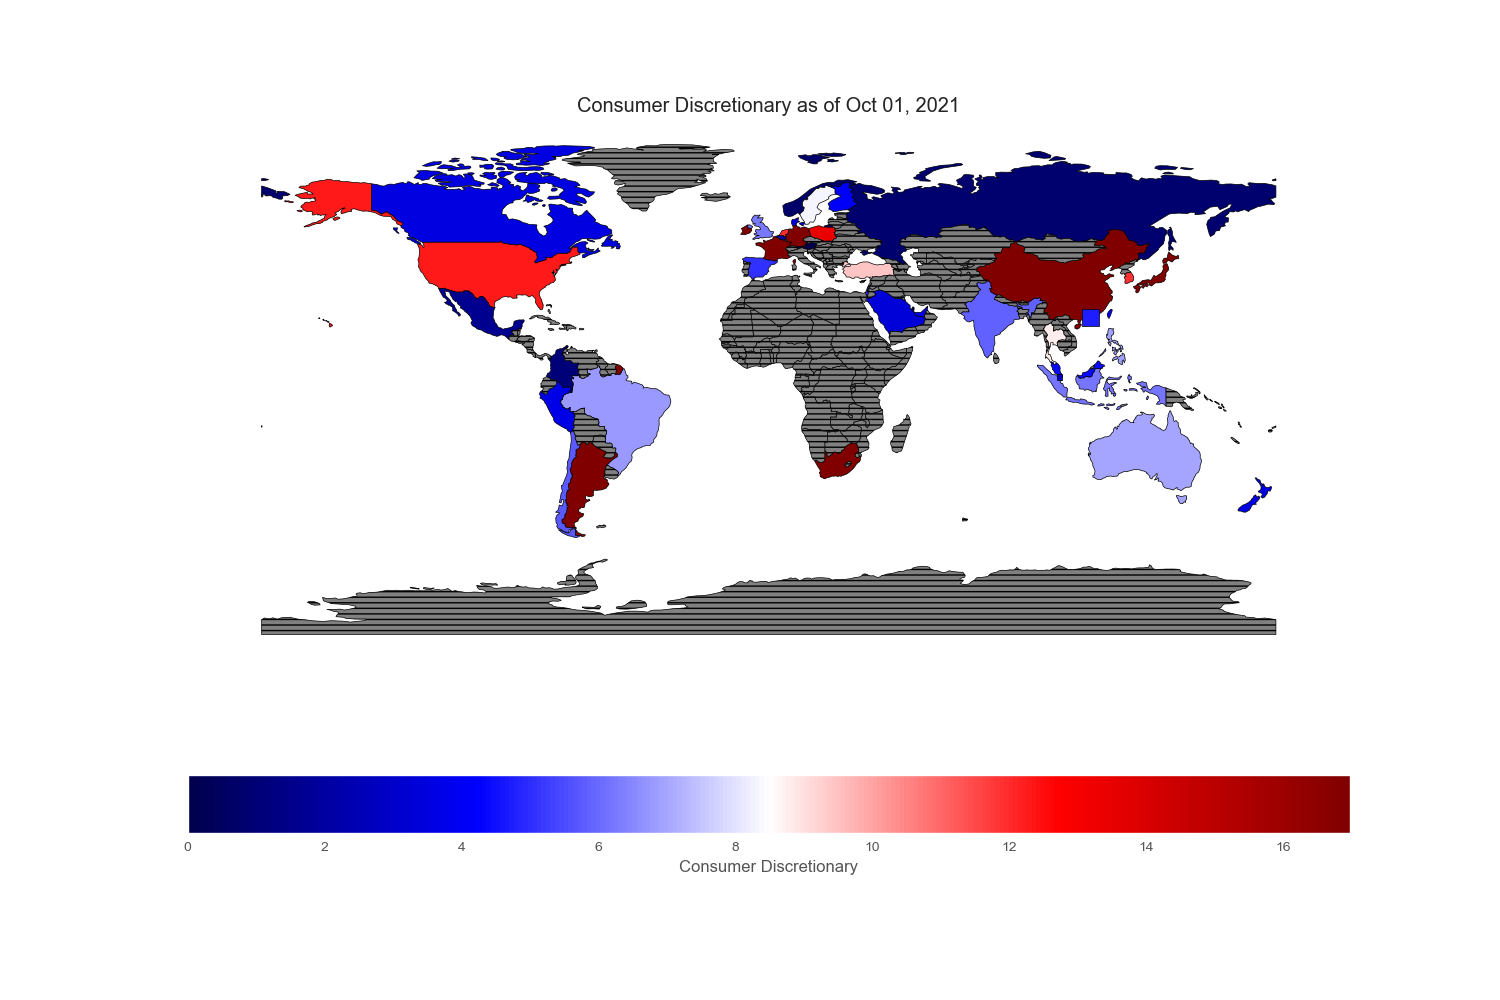
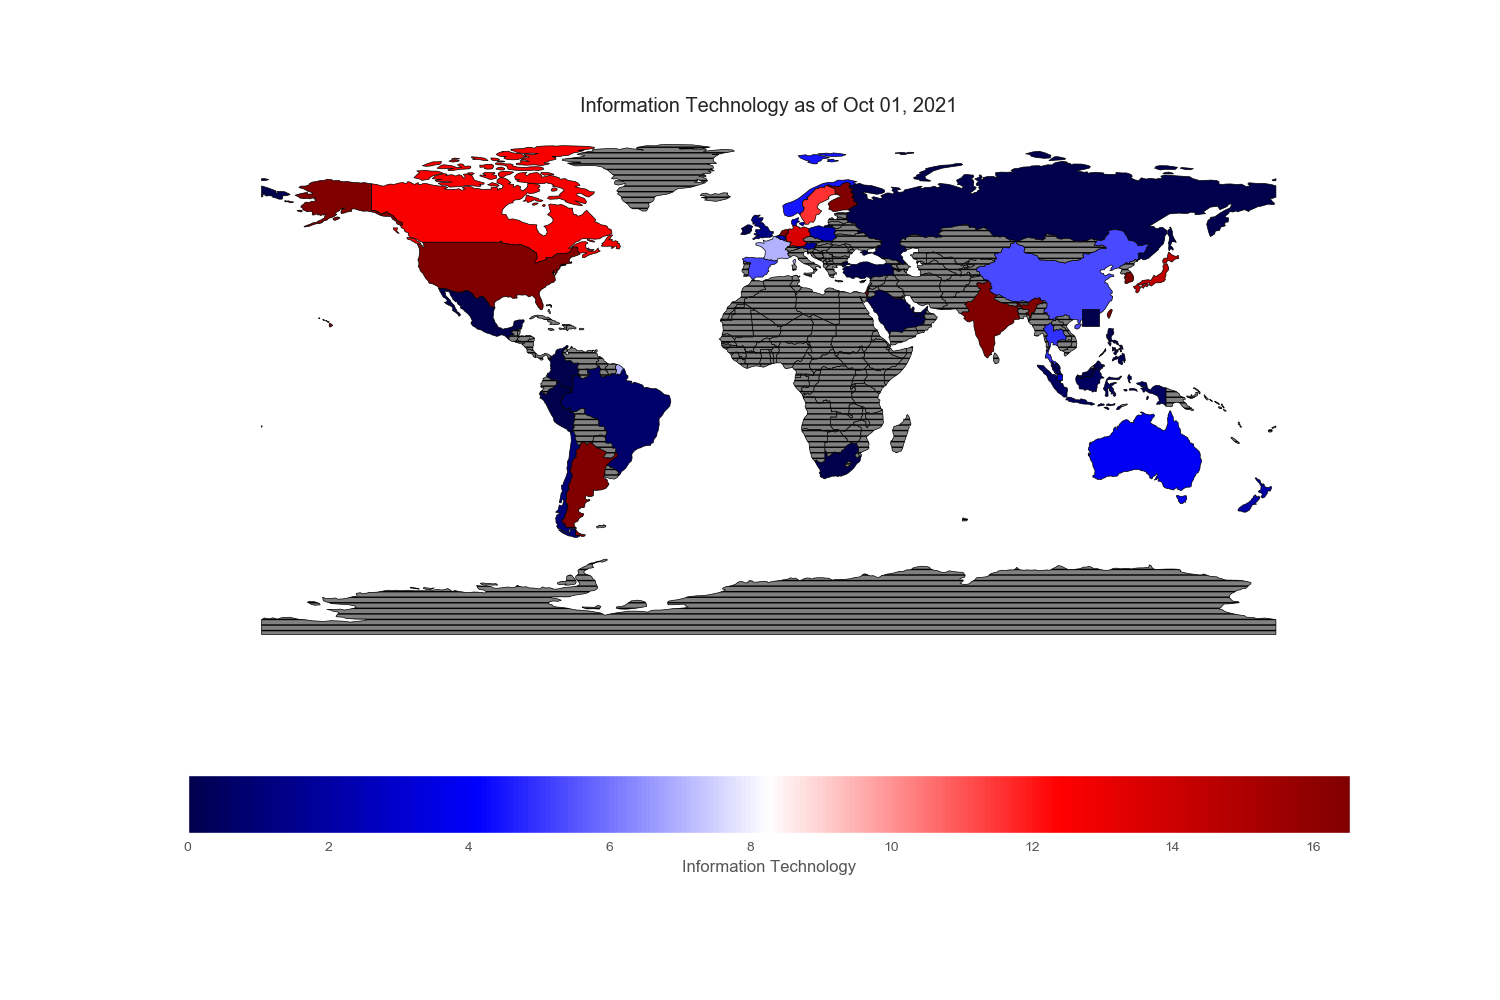
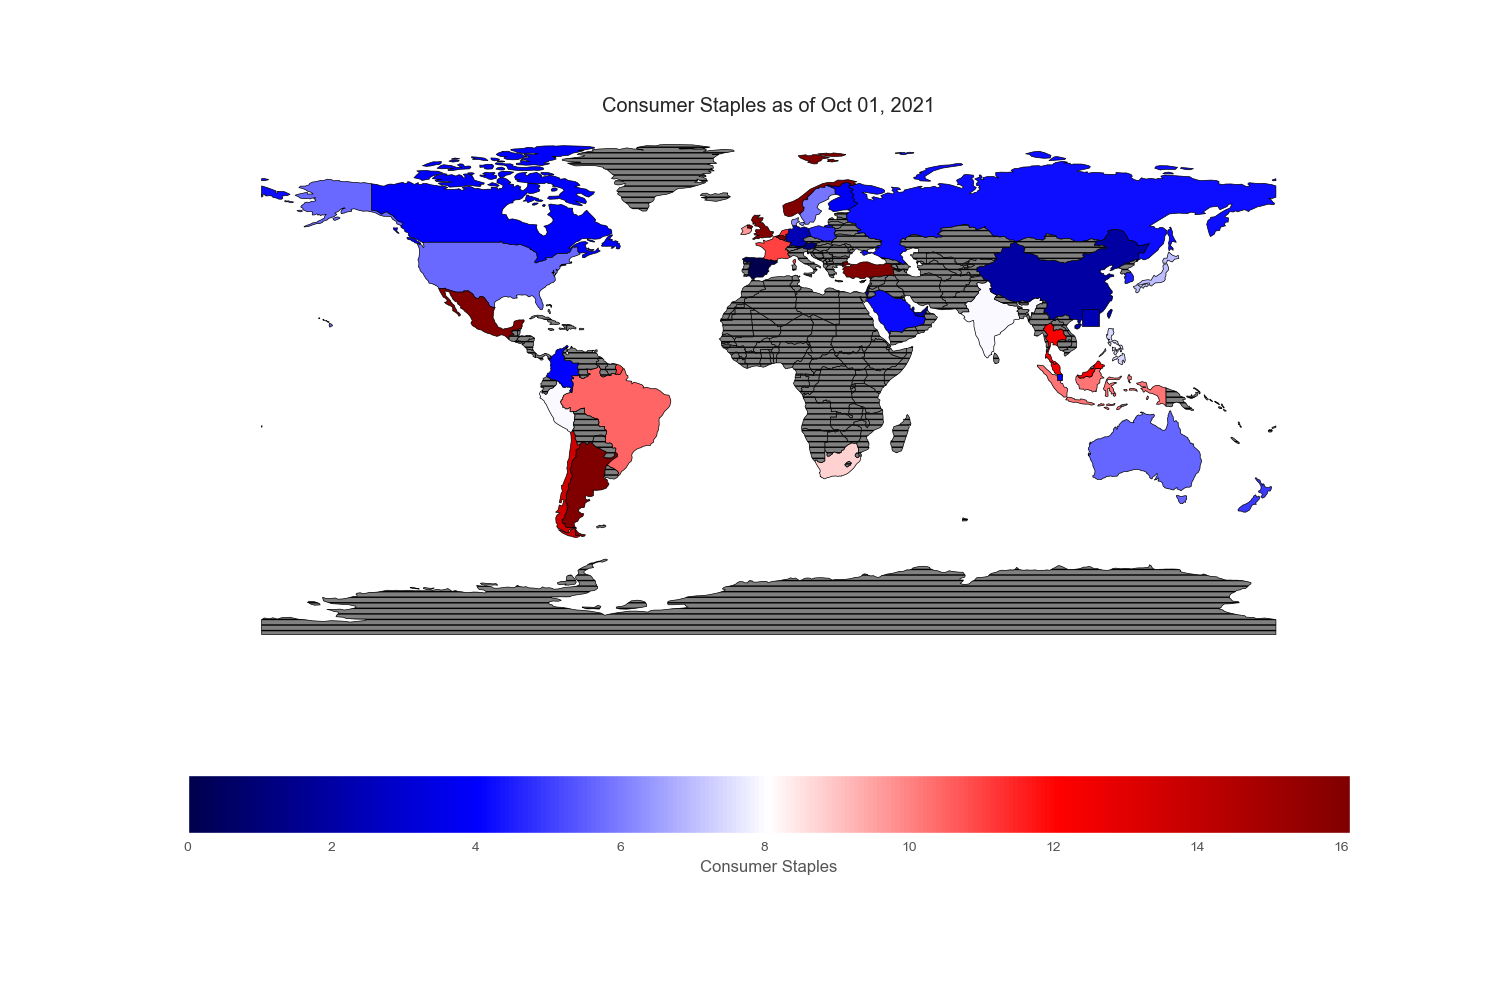
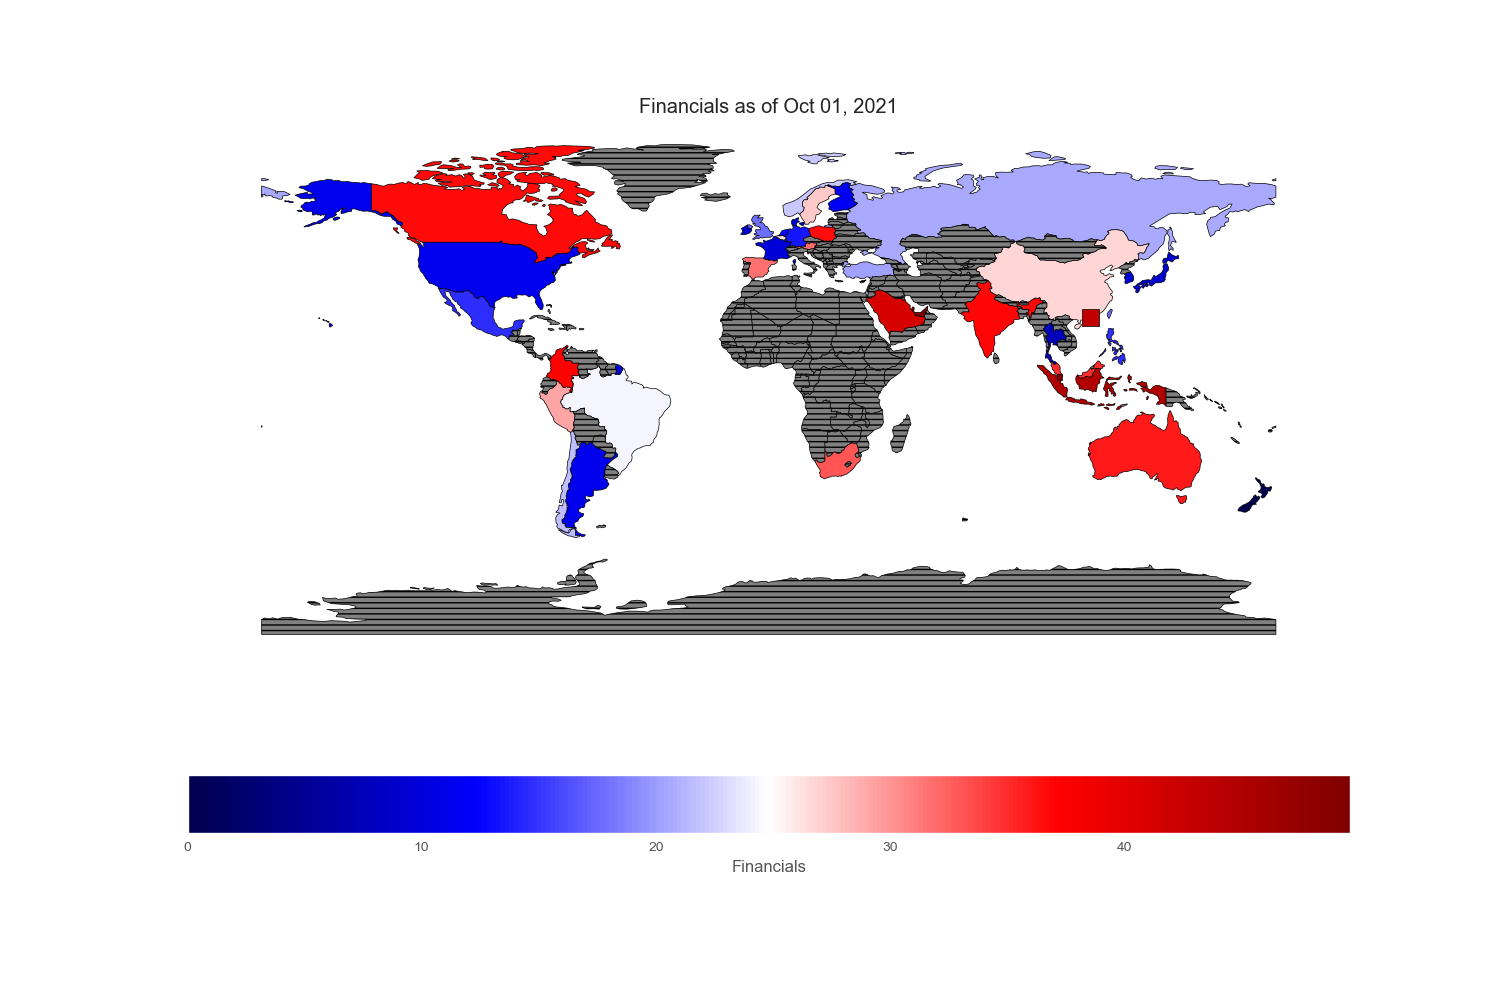
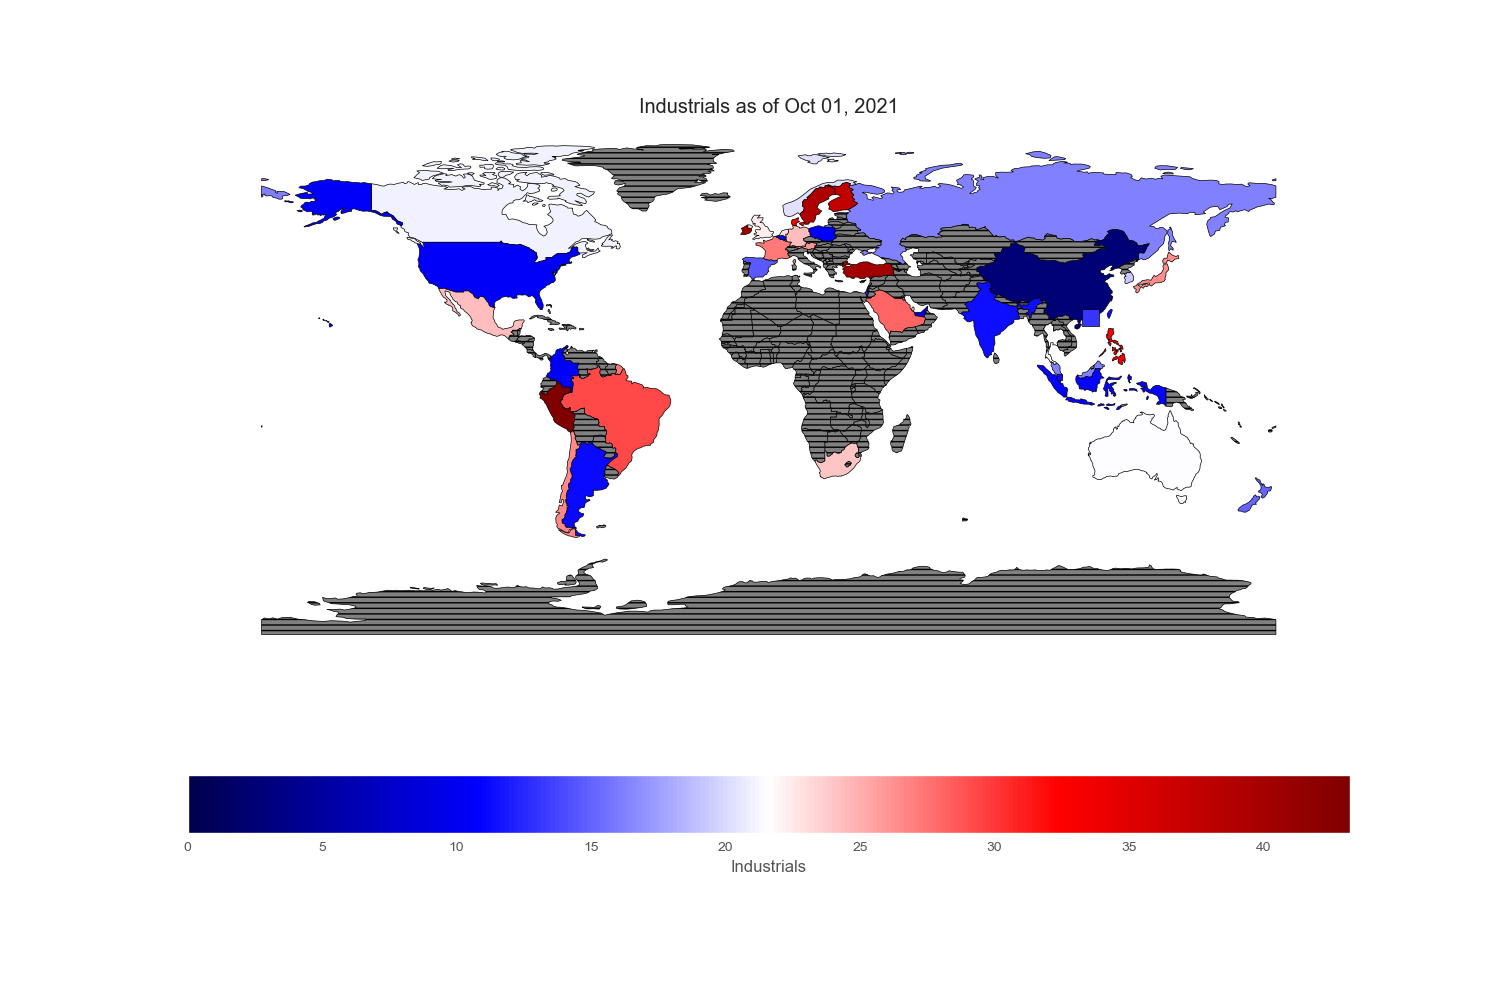
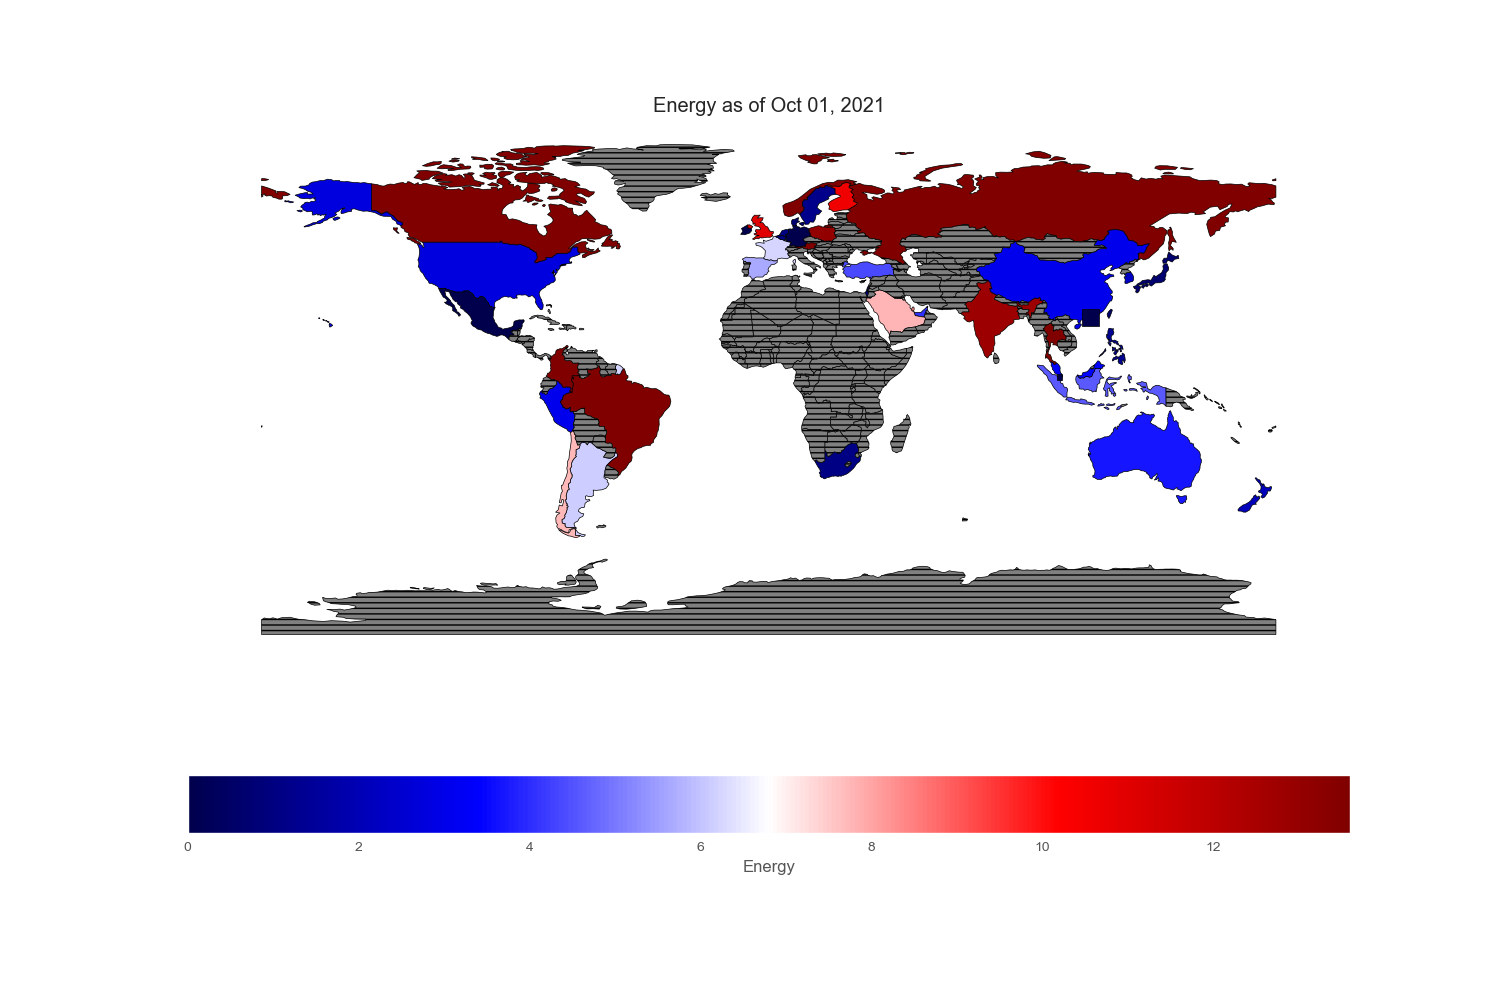
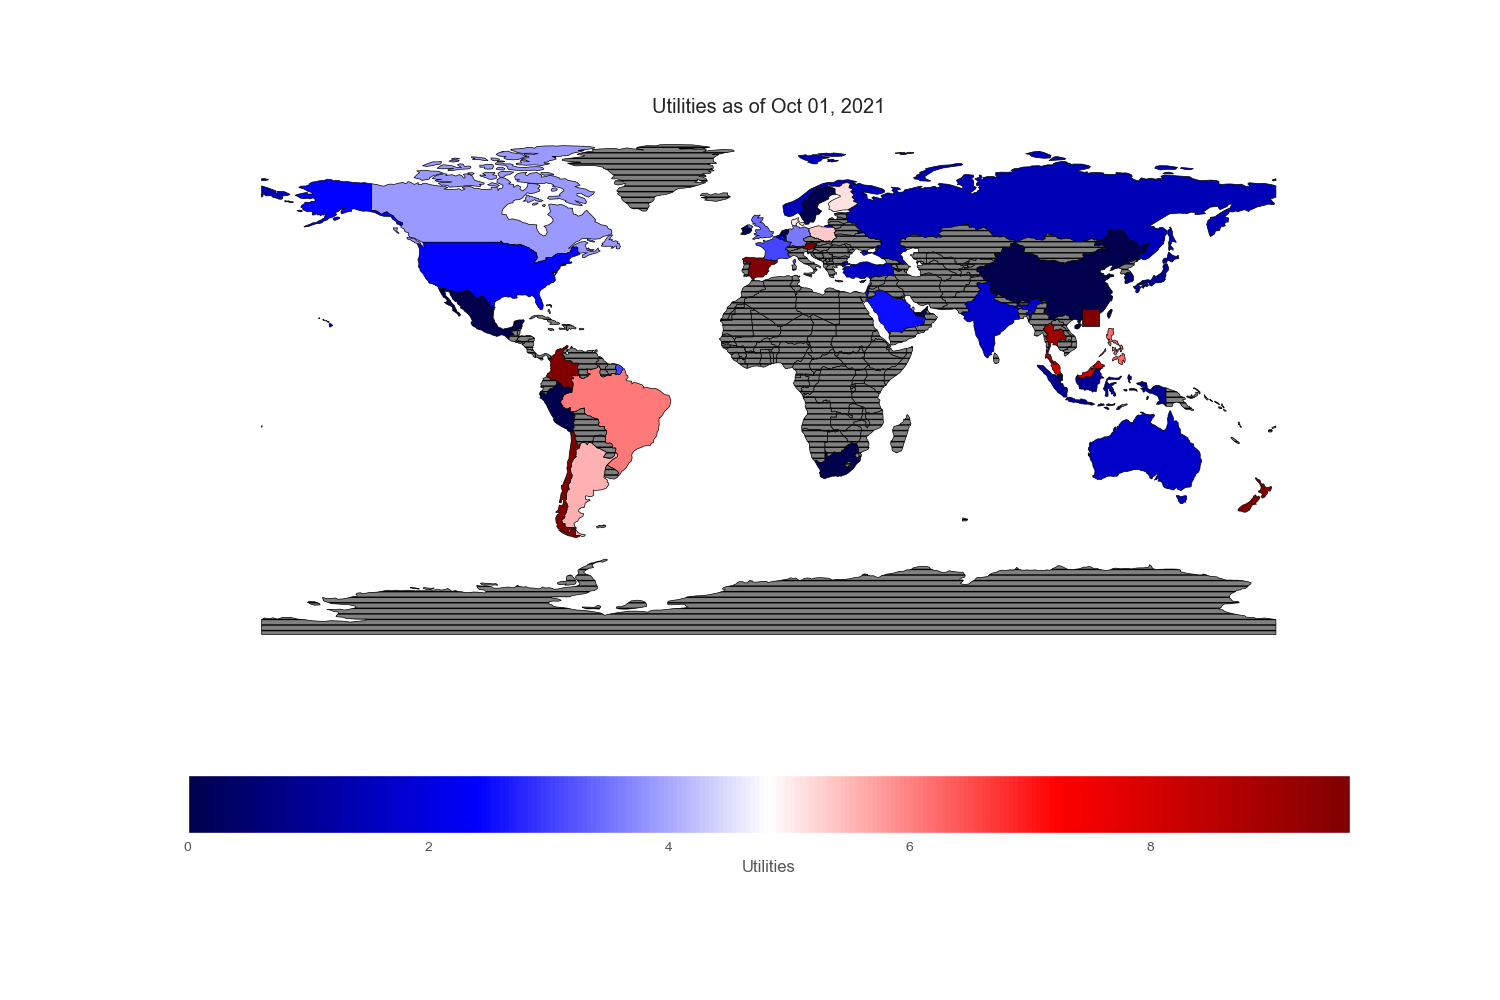
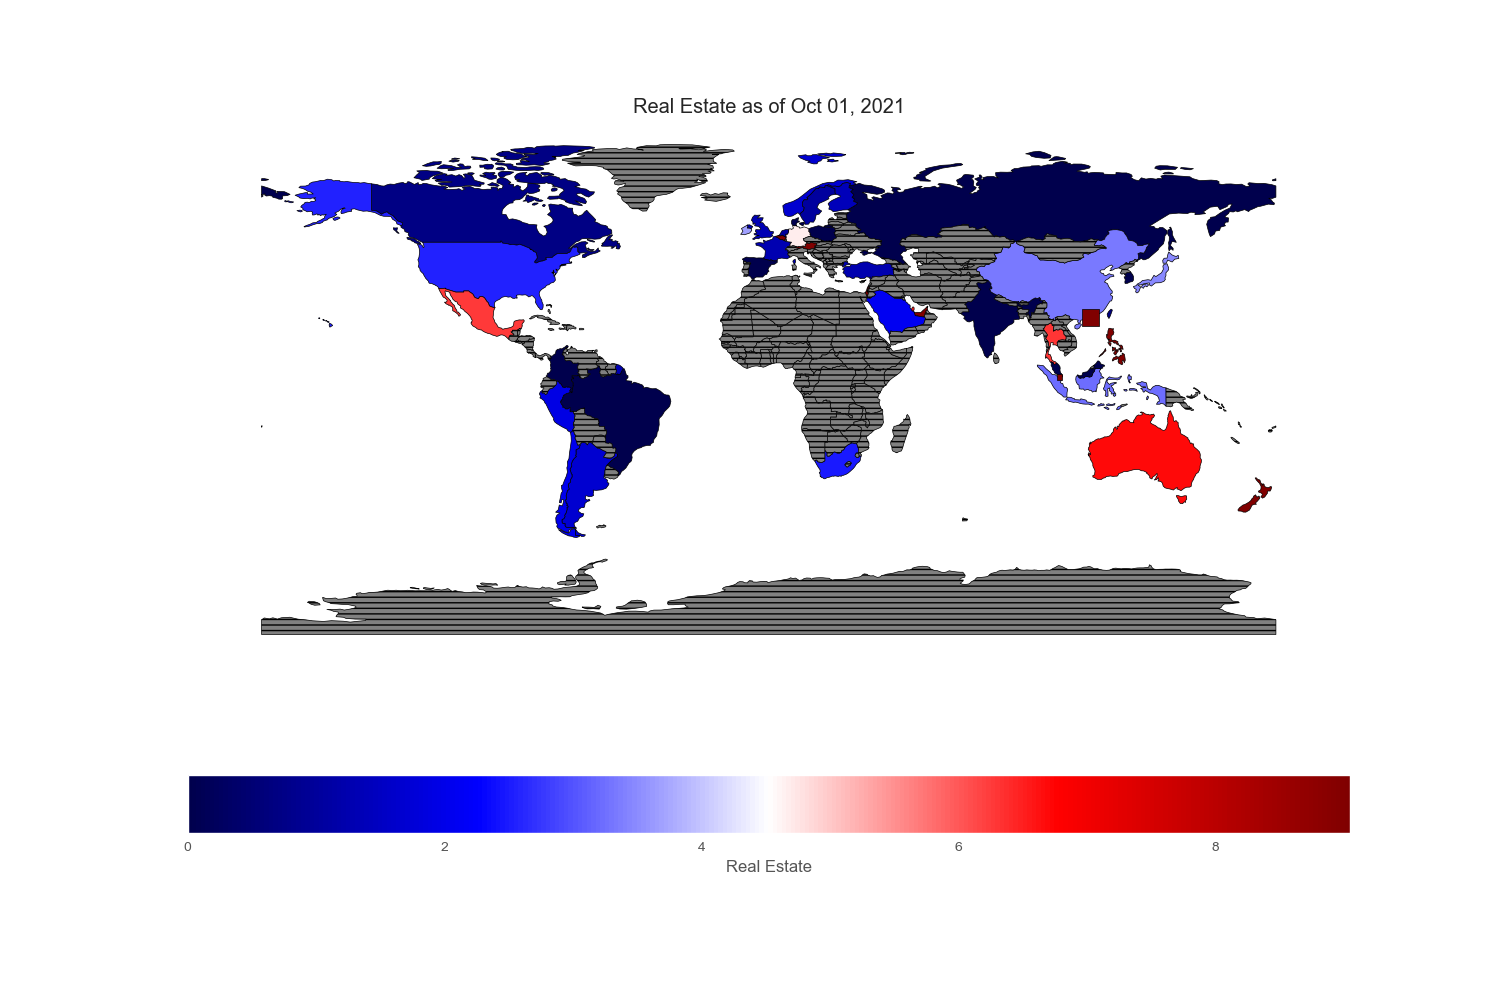
Geopandas provides a very nice world map from its “naturalearth_lowres” dataset in which each country is depicted by polygons. However, I could not find Hong Kong and Singapore on this map, so I drew an excessively large square to reflect their prominent position in the flow of capital across the world markets.
Since my intention is to compare and contrast various equity markets across the globe, let mean value to be white, below mean value to be blue and above mean value to be red. Thus, the intensity of the colored world maps indicates “excesses”. Black stripes refers to regions with no information.
Figures and Plots
Characteristics
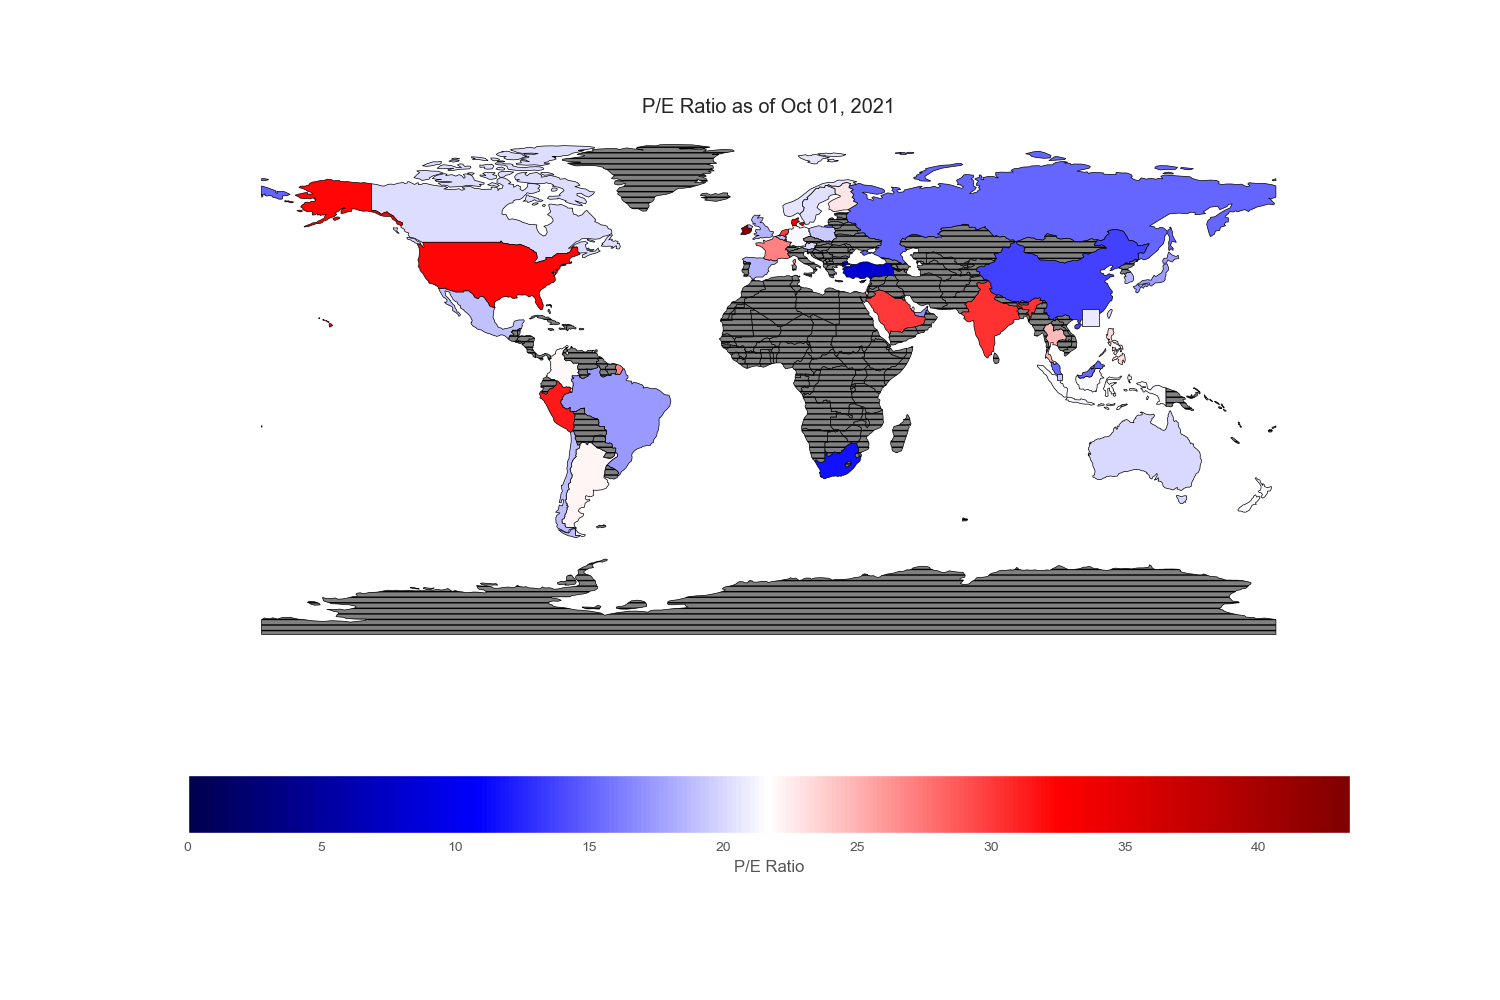
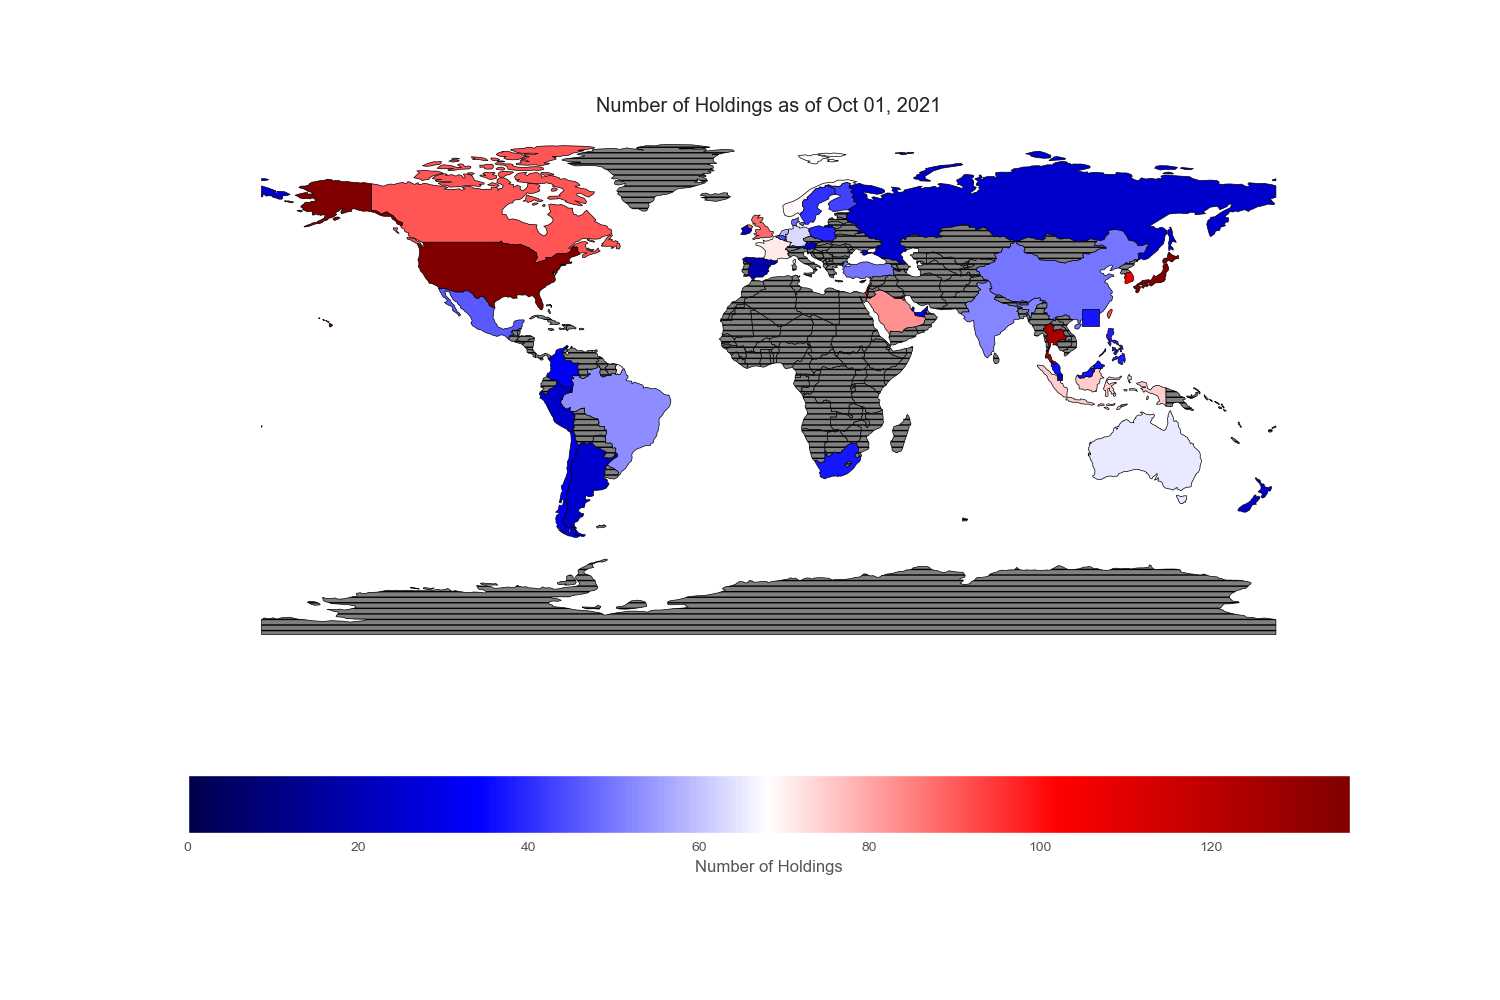
.png)
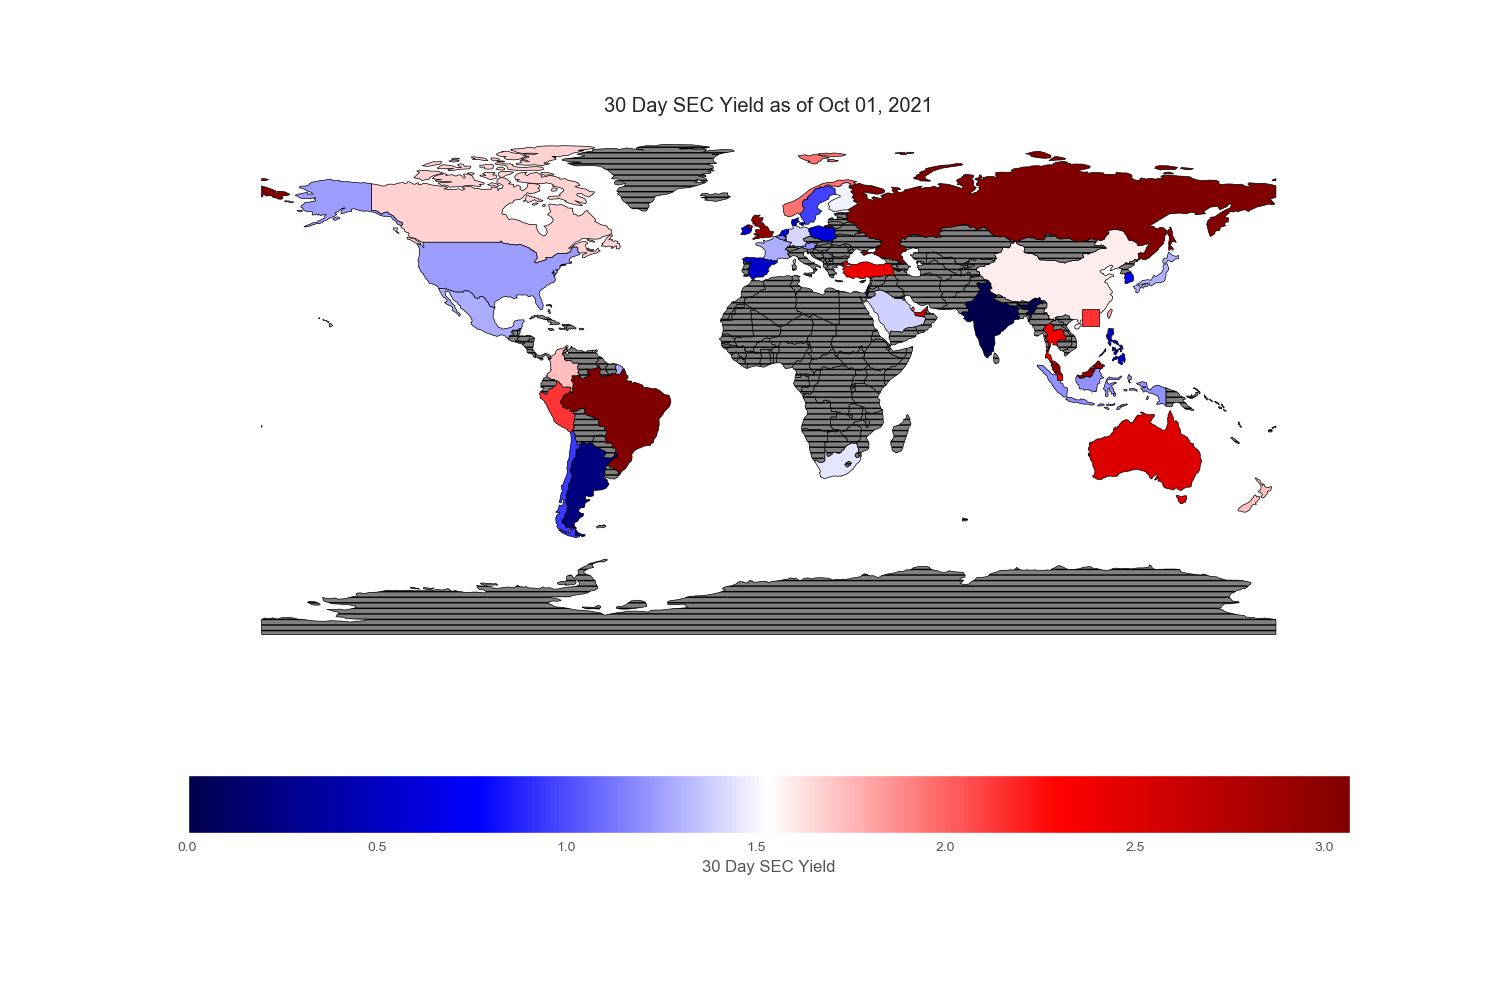
.png)
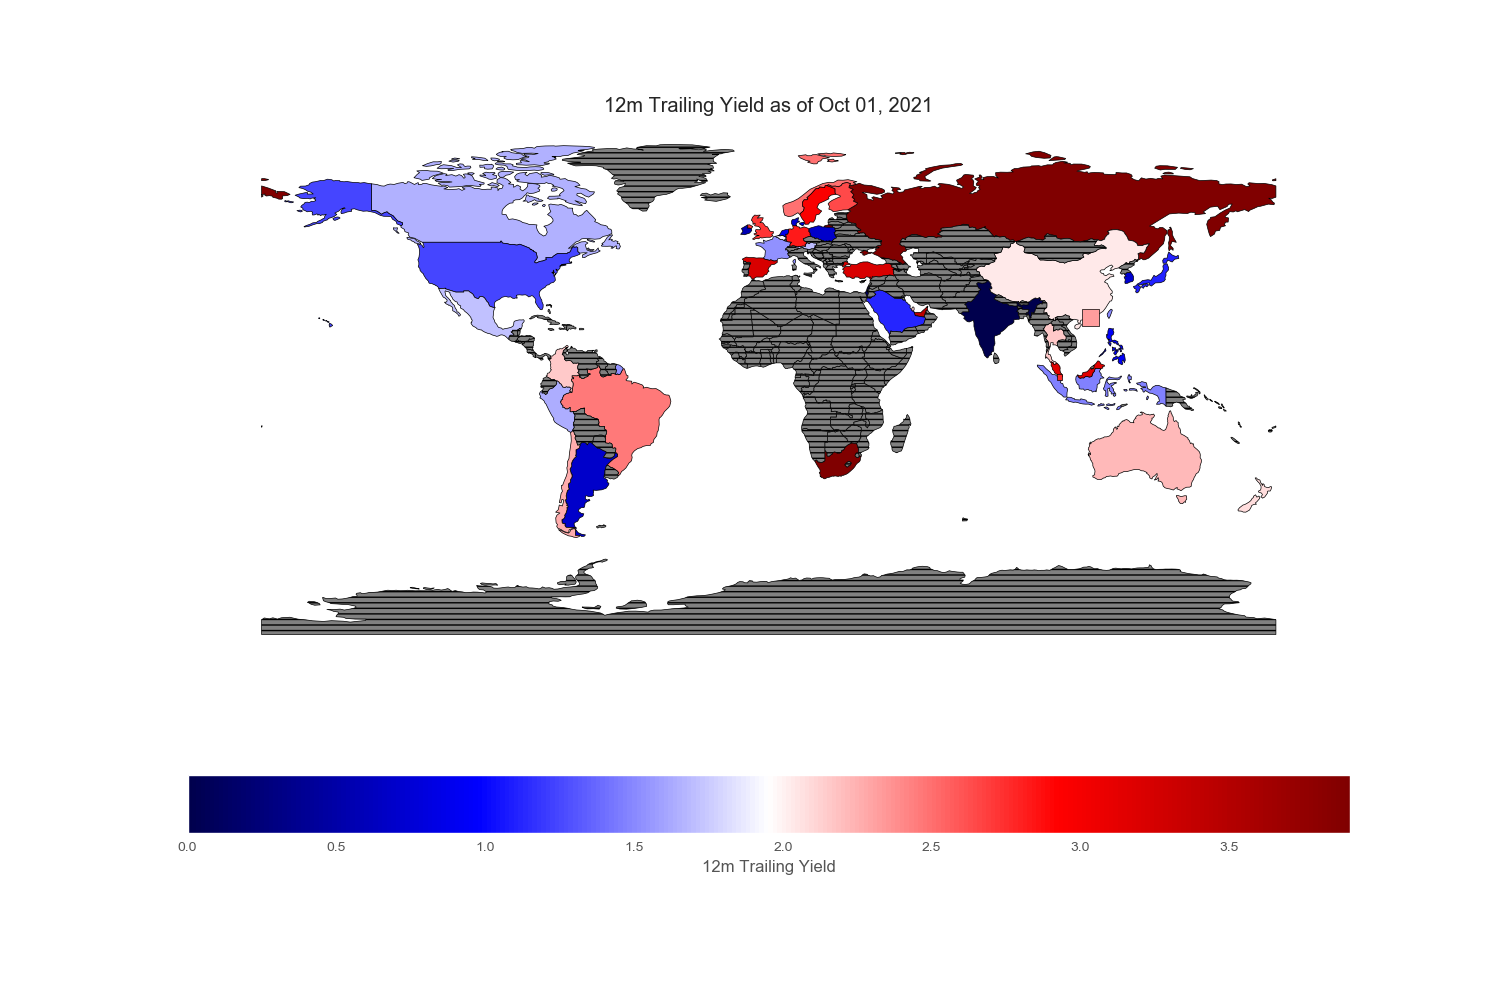
Sectors and Industries
Sectors reported on the ishare websites are not standardized. To cope with country without certain sectors or few sectors that are subcategory of boarder sectors, I regrouped and renamed specific sectors found in each country. All numbers are in %.
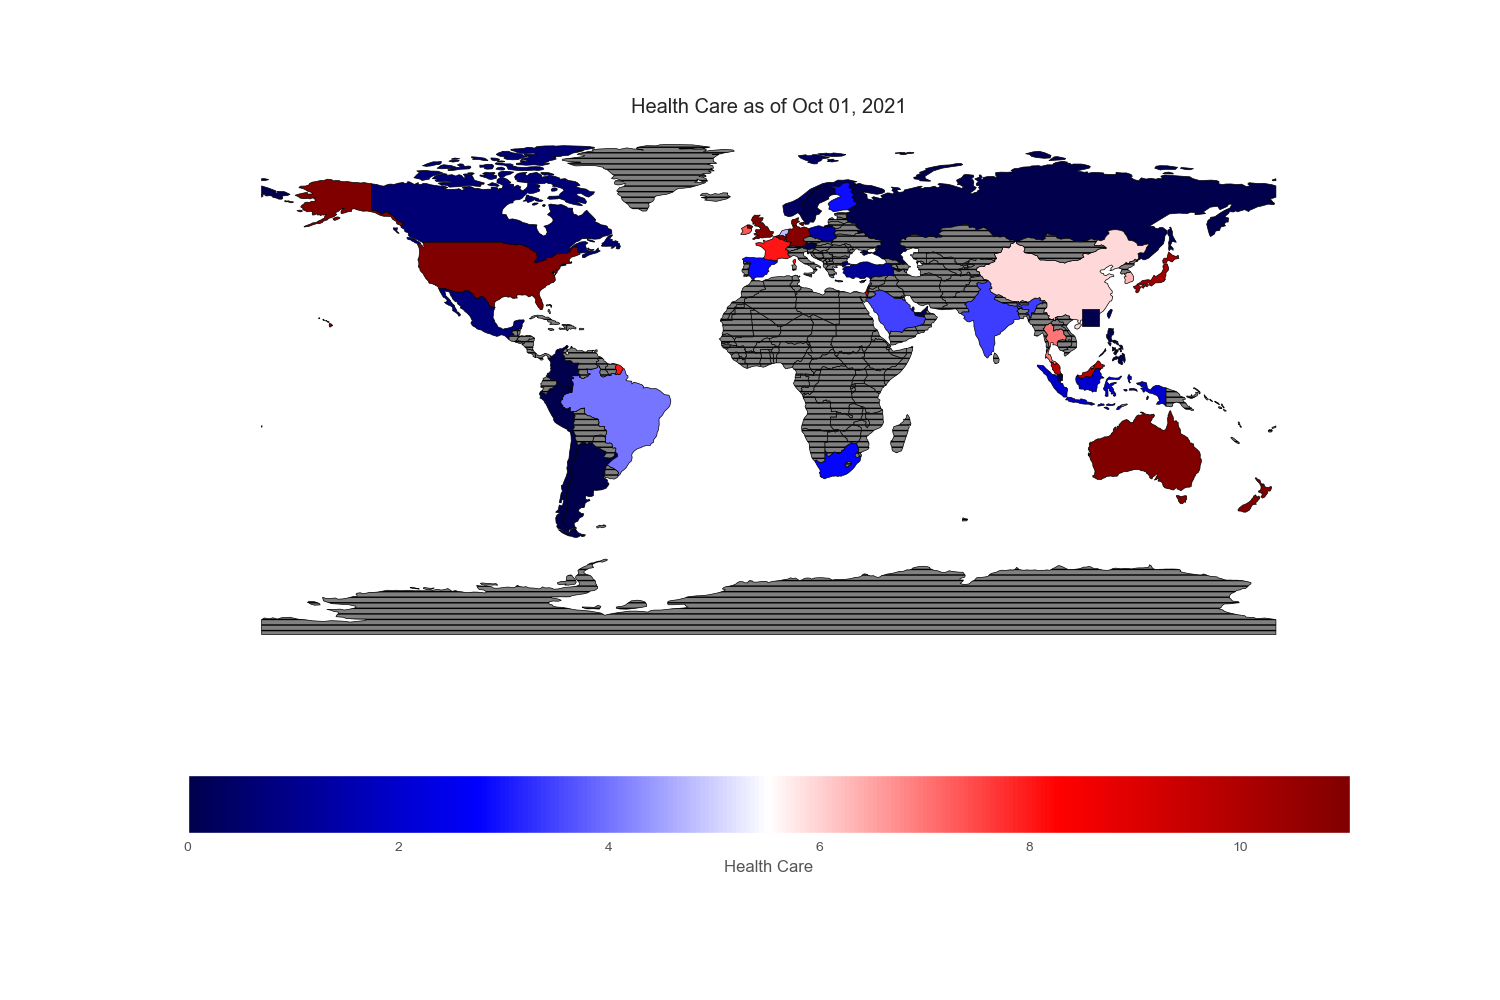
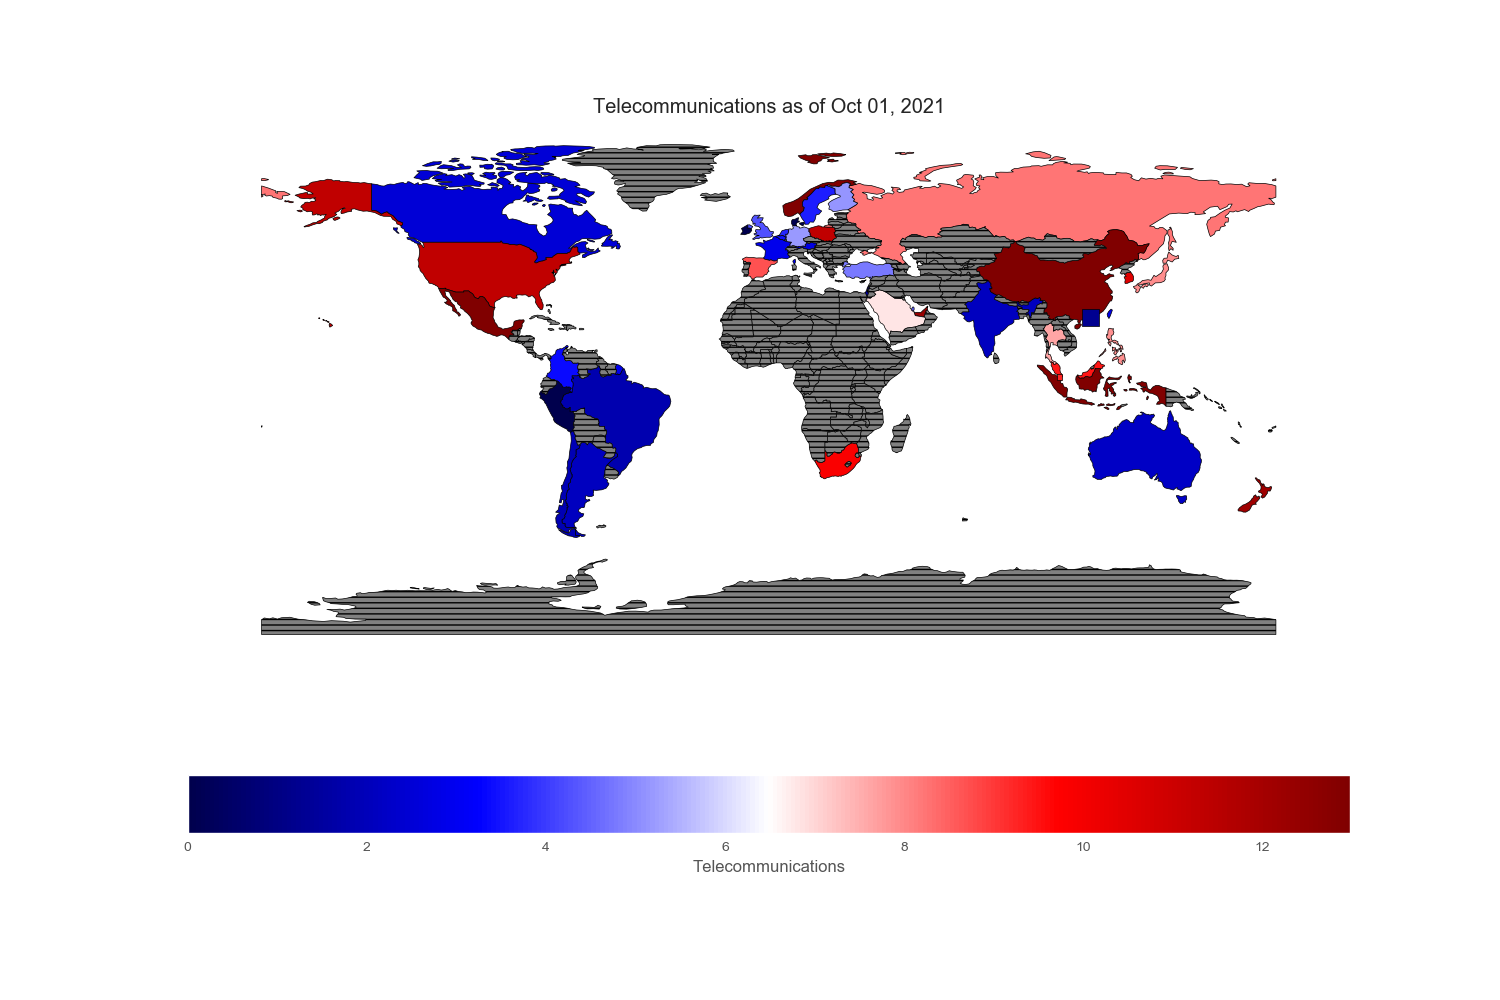
Conclusion
Ishares have not currently provided much access to Africa. I have seen other issuers offer ETFs on African counties such as Egypt, but not much else. Nonetheless, given its sheer size, population, and resources, I reckon Africa’s equity markets are the least developed and accessible compared with other corners of the world. Perhaps, one possible way to invest in the continent is to invest in multi-national companies with operations in Africa. I shall leave it here. Let the figures and code speak for themselves and let my readers draw their own conclusion.
Python scripts
Download Data
# -*- coding: utf-8 -*-

import urllib.request
import re
from collections import defaultdict
import pandas as pd

TARGETS = ['<div class="float-left in-left col-priceBook',
           '<div class="float-left in-right col-priceEarnings',
           '<div class="float-left in-left col-numHoldings',
           '<div class="float-left in-right col-beta3Yr',
           '<div class="float-left in-left col-thirtyDaySecYield',
           '<div class="float-left in-right col-standardDeviation3Yr',
           '<div class="float-left in-left col-twelveMonTrlYld']


GROUPS= {
 'Materials': 'Industrials',
 'Communication':'Telecommunications',
 'Insurance': 'Financials',
 'Diversified Financials':  'Financials',
 'Capital Goods':'Industrials',
 'Banks' : 'Financials',
 'Consumer Services': 'Consumer Discretionary',
 'Transportation': 'Utilities',
 'Food Bevg Tobacco': 'Consumer Staples'}


board_categories = ['Consumer Discretionary',
 'Information Technology',
 'Consumer Staples',
 'Financials',
 'Industrials',
 'Energy',
 'Utilities',
 'Real Estate',
 'Health Care',
 'Telecommunications']

def locate(target, html):


    for i, line in enumerate(html):
        if target in line:
            print ('line {} \n target {}'.format(line, target))
            print ()
            return i
    else:
        print ('cannot find {}'.format(target))
        return None

def extract(i, html):
    # print (html[i:i+10])
    return html[i+2], html[i+5], html[i+9]


def parse_javascript(x):

    start_ind = []
    end_ind = []


    ranking = defaultdict(list)

    for j, c in enumerate(x):
        if '{'  == c:
            start_ind.append(j)
        elif '}' == c:
            end_ind.append(j)

    assert len(start_ind) == len(end_ind)
    for s,e in zip(start_ind, end_ind):
        # print (html[i][s:e])
        items = x[s:e].split(',')

        value = items[0].split(':')[-1]
        value = re.findall('\w+', value)
        ranking['category'].append(' '.join(value))

        value = items[1].split(':')[-1]
        ranking['percentage'].append(float(re.findall('\d+\.\d+', value)[0]))
        ranking['rank'].append(int(items[2].split(':')[-1]))


    print ('found %d categories' %len(start_ind))

    return ranking


if __name__ == "__main__":


    with open('weblinks.txt', 'r') as f:
        links  = f.readlines()


    data = defaultdict(list)

    categories = []

    for link in links:
        link = link.rstrip('\n')
        country = link.split('/')

        myURL = urllib.request.urlopen(link)
        html = myURL.read()
        html = html.decode('utf-8')
        html = html.split('\n')

        target = 'var tabsSectorDataTable =[{"name":'
        i = locate(target, html)

        ranking = parse_javascript(html[i])

        # find all possible categories
        # for category in ranking['category']:
        #     if category not in categories:
        #         categories.append(category)


        for j, target in enumerate(TARGETS):

            i = locate(target, html)

            metric, date, value = extract(i, html)

            if j == 0:
                data['country'].append(country)
                data['dates'].append(date)

            data[metric].append(value)


        percentages = defaultdict(float)

        for c, p  in zip(ranking['category'], ranking['percentage']):

            if c in GROUPS:
                c = GROUPS[c]

            if c in board_categories:
                percentages[c] += p


        print ('check sum: ', sum(percentages.values()))


        for category in board_categories:
            data[category].append(percentages[category])


    for key, value in data.items():
        print (key, len(value))

    table = pd.DataFrame.from_dict(data)

    table.to_csv('etf_Statistics.csv')
Visualization
import pandas as pd
import geopandas
import numpy as np

# import folium
import matplotlib.pyplot as plt
from shapely.geometry import Polygon

def str_float(x):
    return float(x[0:-1])

table = pd.read_csv('etf_Statistics.csv')

for c in ['30 Day SEC Yield',
       'Standard Deviation (3y)',
       '12m Trailing Yield']:

    table[c] = table[c].apply(str_float)


# Read the geopandas dataset
world = geopandas.read_file(geopandas.datasets.get_path('naturalearth_lowres'))
df = pd.DataFrame(
    {'name': ['Hong Kong', 'Singapore'],
     'geometry': [Polygon([(111.177216, 19.302711),
                           (117.177216, 19.302711),
                           (117.177216, 25.302711),
                           (111.177216, 25.302711)]),
                  Polygon([(102.177216, 2.302711),
                           (104.177216, 2.302711),
                           (104.177216, 0.302711),
                           (102.177216, 0.302711)])
                  ]})

world = pd.concat((world, df))

print(world.head())


names = world.name.tolist()


translation = {}

for c in table['country']:
    # print ('------------------')
    for name in names:
        name2 = name.lower()
        name2 = name2.replace(' ', '-')

        if name2 in c:
            translation[c] = name
            break

    else:
        print (c)

# have to specify the country's name for some
for c in table['country']:

    if 'sp-500' in c:
        translation[c] = 'United States of America'

    if 'uae' in c:
        translation[c] = 'United Arab Emirates'
    if '287286' in c:
        translation[c] = 'Argentina'

ind = [i for i, t in enumerate(table['country']) if t in translation]

table = table.iloc[ind,:]

table['country'] = [translation[i] for i in table['country']]

table2 = world.merge(table, how="left", left_on=['name'], right_on=['country'])


plt.close('all')
for c in table2.columns[9:]:
    # plt.figure()
    with plt.style.context(("seaborn", "ggplot")):
        ax = table2.plot(c,
                    figsize=(15,10),
                    edgecolor="black",
                    legend=True,
                    legend_kwds={"label": c, "orientation":"horizontal"},
                    cmap=plt.cm.seismic,
                    vmin=0,
                    vmax = np.nanmean(table2[c]) * 2,
                    missing_kwds={
                                    "color":"grey",
                                    "edgecolor":"black",
                                    "hatch":"---",
                                    "label":"Missing Values"
                                }
                )
        ax.set_axis_off()
        plt.title(c + ' ' + table2['dates'][np.invert(table2['dates'].isna())].iloc[0])

        c = c.replace('/', '_')
        c = c.replace(' ', '_')
        plt.savefig (c + ".png", transparent=True)
References
- https://www.ishares.com/us/products/287286/
- https://www.ishares.com/us/products/239689/ishares-msci-turkey-etf
- https://www.ishares.com/us/products/239688/ishares-msci-thailand-capped-etf
- https://www.ishares.com/us/products/239618/ishares-msci-chile-capped-etf
- https://www.ishares.com/us/products/239621/ishares-msci-denmark-capped-etf
- https://www.ishares.com/us/products/239647/ishares-msci-finland-capped-etf
- https://www.ishares.com/us/products/239661/ishares-msci-indonesia-etf
- https://www.ishares.com/us/products/239662/ishares-msci-ireland-capped-etf
- https://www.ishares.com/us/products/239663/ishares-msci-israel-capped-etf
- https://www.ishares.com/us/products/239673/ishares-msci-norway-capped-etf
- https://www.ishares.com/us/products/239672/ishares-msci-new-zealand-capped-etf
- https://www.ishares.com/us/products/239675/ishares-msci-philippines-etf
- https://www.ishares.com/us/products/239676/ishares-msci-poland-capped-etf
- https://www.ishares.com/us/products/239606/ishares-msci-all-peru-capped-etf
- https://www.ishares.com/us/products/239677/ishares-msci-russia-capped-etf
- https://www.ishares.com/us/products/239607/ishares-msci-australia-etf
- https://www.ishares.com/us/products/239615/ishares-msci-canada-etf
- https://www.ishares.com/us/products/239684/ishares-msci-sweden-etf
- https://www.ishares.com/us/products/239650/ishares-msci-germany-etf
- https://www.ishares.com/us/products/239657/ishares-msci-hong-kong-etf
- https://www.ishares.com/us/products/239665/ishares-msci-japan-etf
- https://www.ishares.com/us/products/239610/ishares-msci-belgium-capped-etf
- https://www.ishares.com/us/products/239669/ishares-msci-malaysia-etf
- https://www.ishares.com/us/products/239671/ishares-msci-netherlands-etf
- https://www.ishares.com/us/products/239609/ishares-msci-austria-capped-etf
- https://www.ishares.com/us/products/239683/ishares-msci-spain-capped-etf
- https://www.ishares.com/us/products/239648/ishares-msci-france-etf
- https://www.ishares.com/us/products/239678/ishares-msci-singapore-capped-etf
- https://www.ishares.com/us/products/239686/ishares-msci-taiwan-etf
- https://www.ishares.com/us/products/239690/ishares-msci-united-kingdom-etf
- https://www.ishares.com/us/products/239670/ishares-msci-mexico-capped-etf
- https://www.ishares.com/us/products/239681/ishares-msci-south-korea-capped-etf
- https://www.ishares.com/us/products/239612/ishares-msci-brazil-capped-etf
- https://www.ishares.com/us/products/239680/ishares-msci-south-africa-etf
- https://www.ishares.com/us/products/239536/ishares-china-largecap-etf
- https://www.ishares.com/us/products/254562/ishares-msci-colombia-capped-etf
- https://www.ishares.com/us/products/239758/ishares-india-50-etf
- https://www.ishares.com/us/products/271542/ishares-msci-saudi-arabia-capped-etf
- https://www.ishares.com/us/products/264273/ishares-msci-qatar-capped-etf
- https://www.ishares.com/us/products/239726/ishares-core-sp-500-etf
- https://www.ishares.com/us/products/264275/ishares-msci-uae-capped-etf

