
In this series, I am going to explore several asset allocation portfolio. Particularly, I am going to study Marc Faber’s Portfolio.
| Asset type | Asset class | Proportion |
|---|---|---|
| US Large Cap | Stocks | 0.13 |
| US Small Cap | Stocks | 0 |
| Foreign Developed | Stocks | 0.08 |
| Foreign Emerging | Stocks | 0.04 |
| Corporate Bonds | Stocks or Bonds | 0 |
| T-Bills | Bonds | 0 |
| 10-year Bonds | Bonds | 0.25 |
| 20-year Bonds | Bonds | 0 |
| 10-year Foreign Bonds | Bonds | 0 |
| TIPS | Real Assets | 0 |
| Commodities | Real Assets | 0 |
| Gold | Real Assets | 0.25 |
| REITs | Real Assets | 0.25 |
I used SPY to represent US large cap, VGK to represent equities in foreign developed markets, VWO to represent foreign emerging markets, AGG to represents aggregated bonds, IYR to represent REIT, and IAU to represent gold.
I ran the backtest from the 1st of April 2005 to the 3rd of April 2020. The start date is determined by the availability of the VWO.
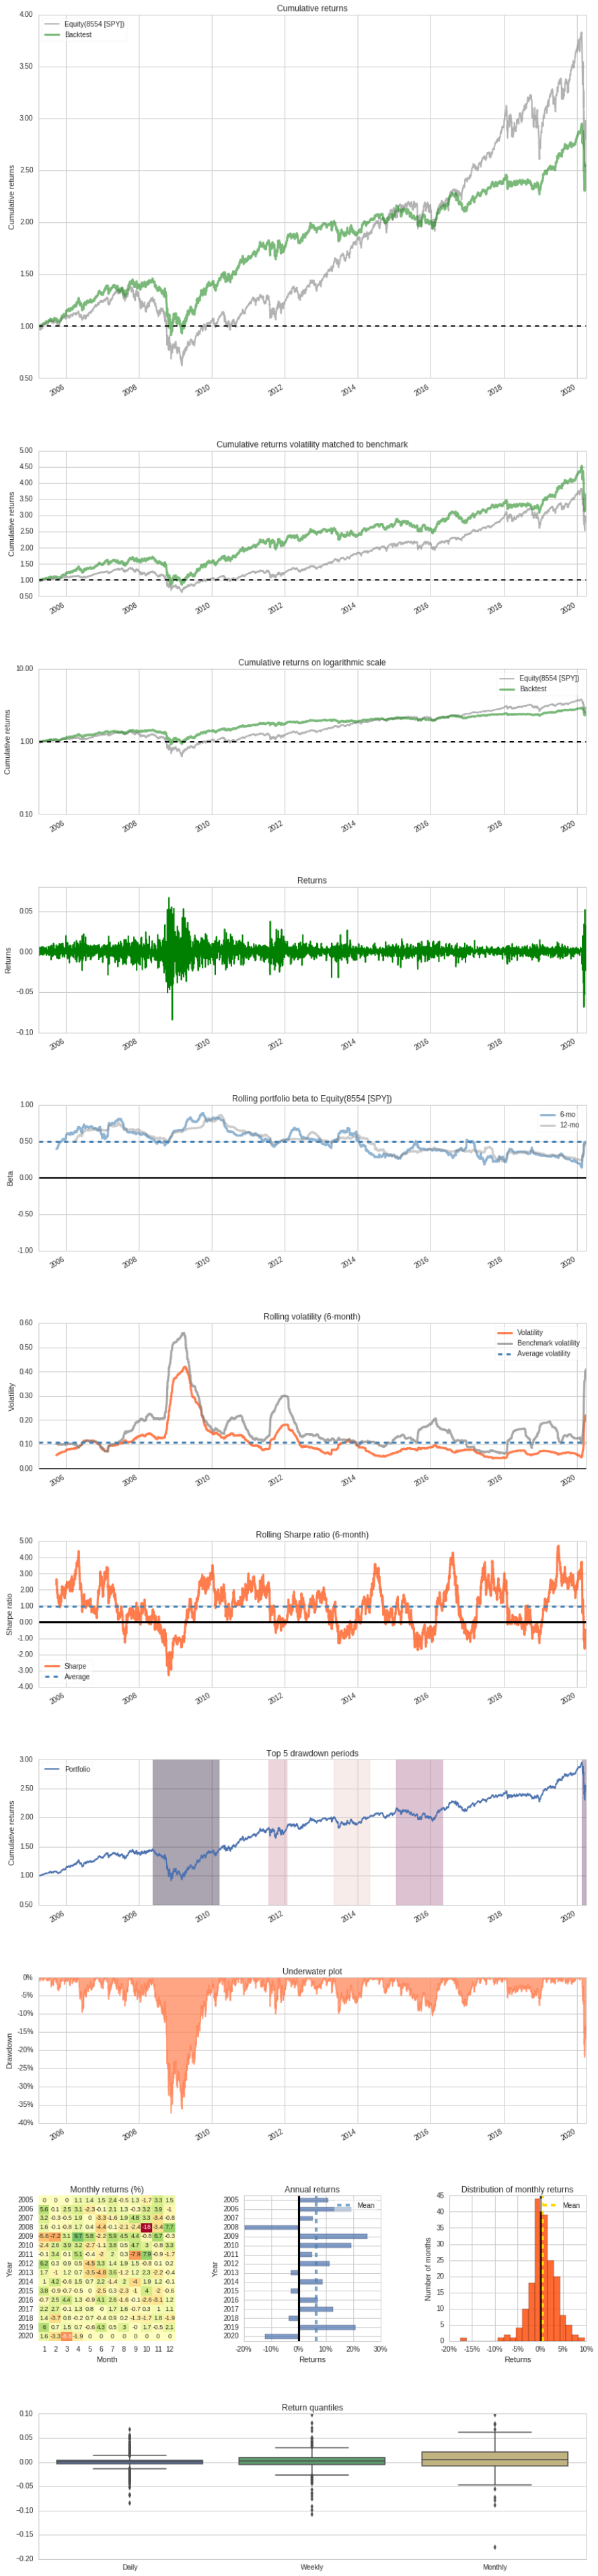
Quantopian algorithm backtesting platform has provided a summary of the performance.
| Annual return | 6.213% |
| Cumulative returns | 146.926% |
| Annual volatility | 13.211% |
| Sharpe ratio | 0.52 |
| Calmar ratio | 0.17 |
| Stability | 0.91 |
| Max drawdown | -37.256% |
| Omega ratio | 1.11 |
| Sortino ratio | 0.73 |
| Skew | -0.31 |
| Kurtosis | 13.32 |
| Tail ratio | 0.97 |
| Daily value at risk | -1.637% |
| Gross leverage | 0.99 |
| Daily turnover | 0.203% |
| Alpha | 0.02 |
| Beta | 0.56 |
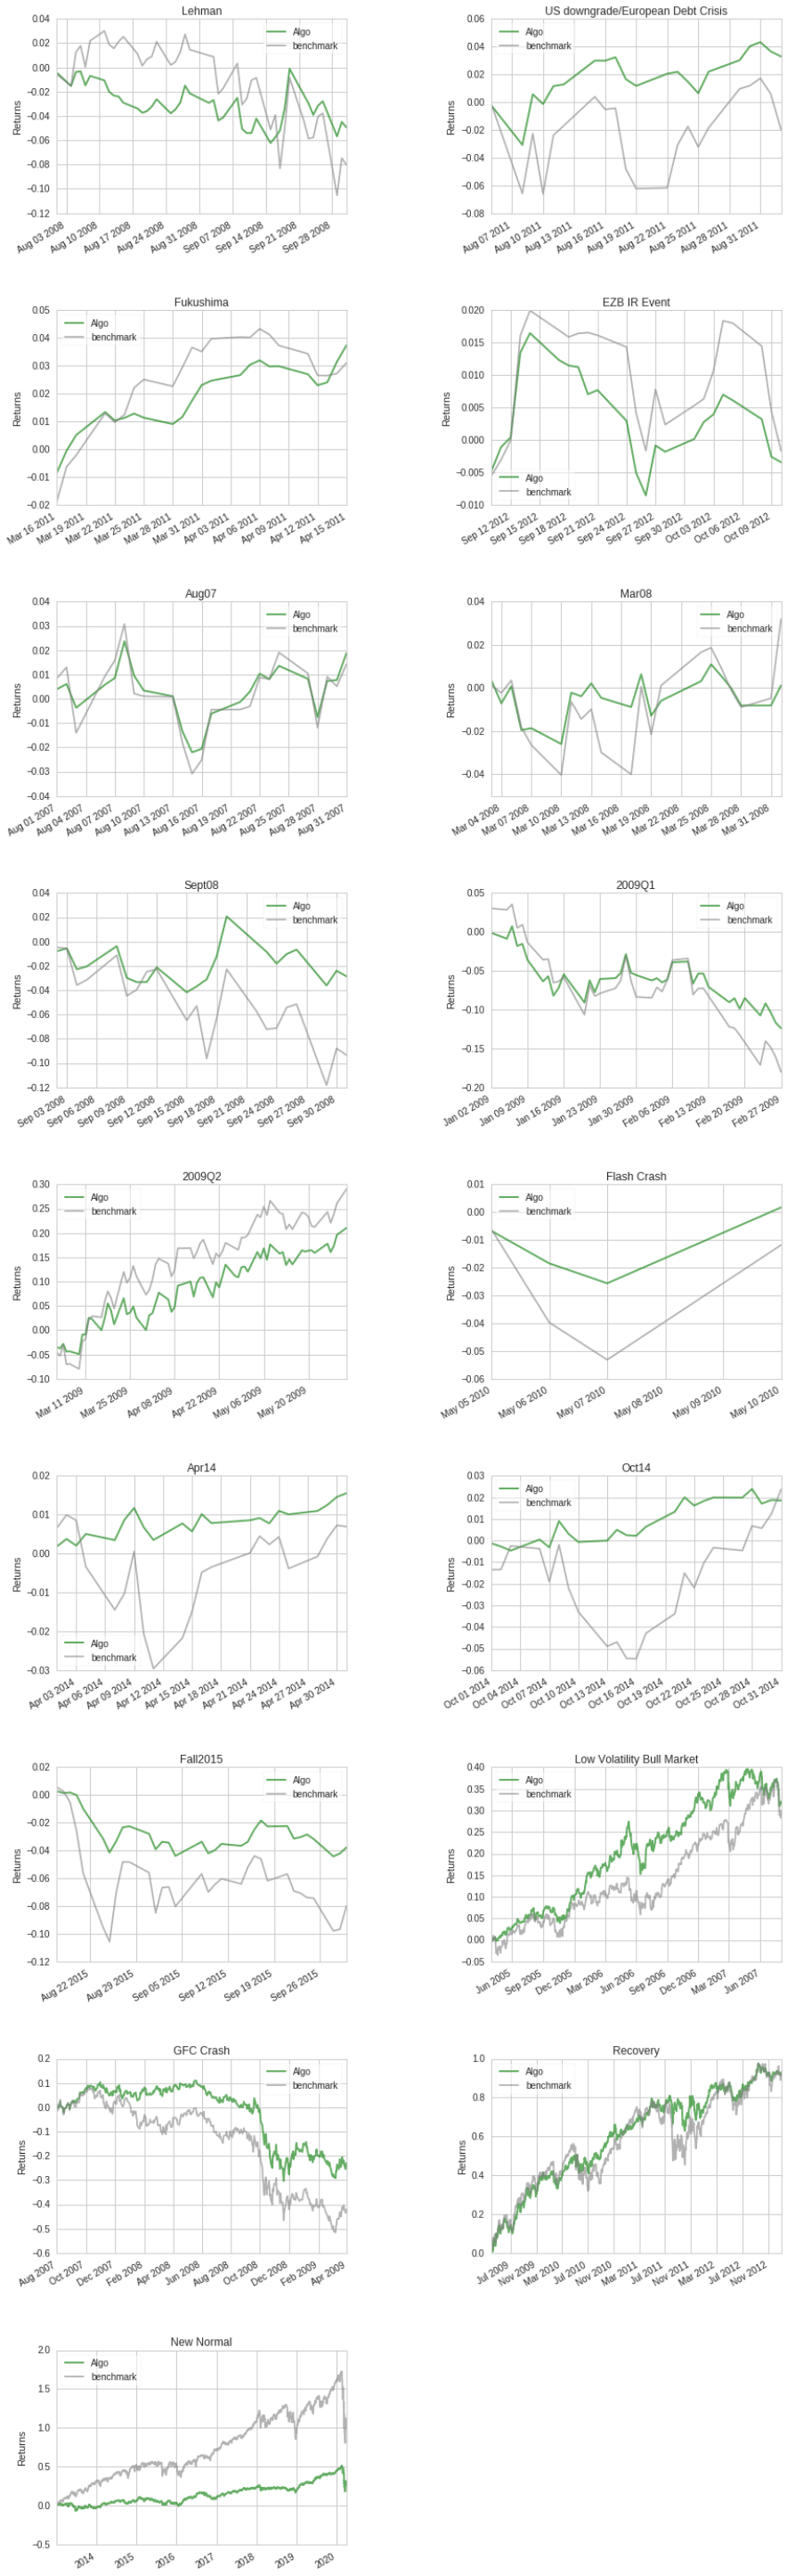
The portfolio’s returns during different time periods or events are summarized below.
| Stress Events | mean | min | max |
|---|---|---|---|
| Lehman | -0.11% | -2.98% | 3.33% |
| US downgrade/European Debt Crisis | 0.16% | -2.85% | 3.77% |
| Fukushima | 0.16% | -0.85% | 0.82% |
| EZB IR Event | -0.01% | -0.80% | 1.31% |
| Aug07 | 0.09% | -1.56% | 1.50% |
| Mar08 | 0.01% | -2.03% | 2.44% |
| Sept08 | -0.12% | -2.98% | 3.33% |
| 2009Q1 | -0.32% | -3.85% | 3.15% |
| 2009Q2 | 0.32% | -3.70% | 5.32% |
| Flash Crash | 0.06% | -1.18% | 2.80% |
| Apr14 | 0.07% | -0.49% | 0.52% |
| Oct14 | 0.08% | -0.66% | 1.22% |
| Fall2015 | -0.12% | -2.16% | 1.07% |
| Low Volatility Bull Market | 0.05% | -2.88% | 2.20% |
| GFC Crash | -0.05% | -8.44% | 6.68% |
| Recovery | 0.07% | -3.70% | 4.20% |
| New Normal | 0.01% | -6.85% | 5.20% |
Below shows an overall summary of the performance over the entire period.
It seems this portfolio is not mitigating or reducing the loss of capital most of the time during the test periods. It also seems its returns are less during New Normal compared with the benchmark. However, during New Normal, we have seen a very strong and long bull market, shown by the high rate of returns of the US equities. This portfolio has only a relatively small portion of fund allocated to US stocks.
Resources used: Asset_allocation_portfolio_backtesting_python_script