
In this series, I am going to explore several asset allocation portfolio. Particularly, I am going to study a Buffett’s portfolio for his trust.
| Asset type | Asset class | Proportion |
|---|---|---|
| US Large Cap | Stocks | 0.9 |
| US Small Cap | Stocks | 0 |
| Foreign Developed | Stocks | 0 |
| Foreign Emerging | Stocks | 0 |
| Corporate Bonds | Stocks or Bonds | 0 |
| T-Bills | Bonds | 0.1 |
| 10-year Bonds | Bonds | 0 |
| 20-year Bonds | Bonds | 0 |
| 10-year Foreign Bonds | Bonds | 0 |
| TIPS | Real Assets | 0 |
| Commodities | Real Assets | 0 |
| Gold | Real Assets | 0 |
| REITs | Real Assets | 0 |
I used SPY to represent US large cap and SHY to represent T-Bills.
I ran the backtest from the 1st of August 2002 to the 3rd of April 2020. The start date is determined by the availability of the SHY.
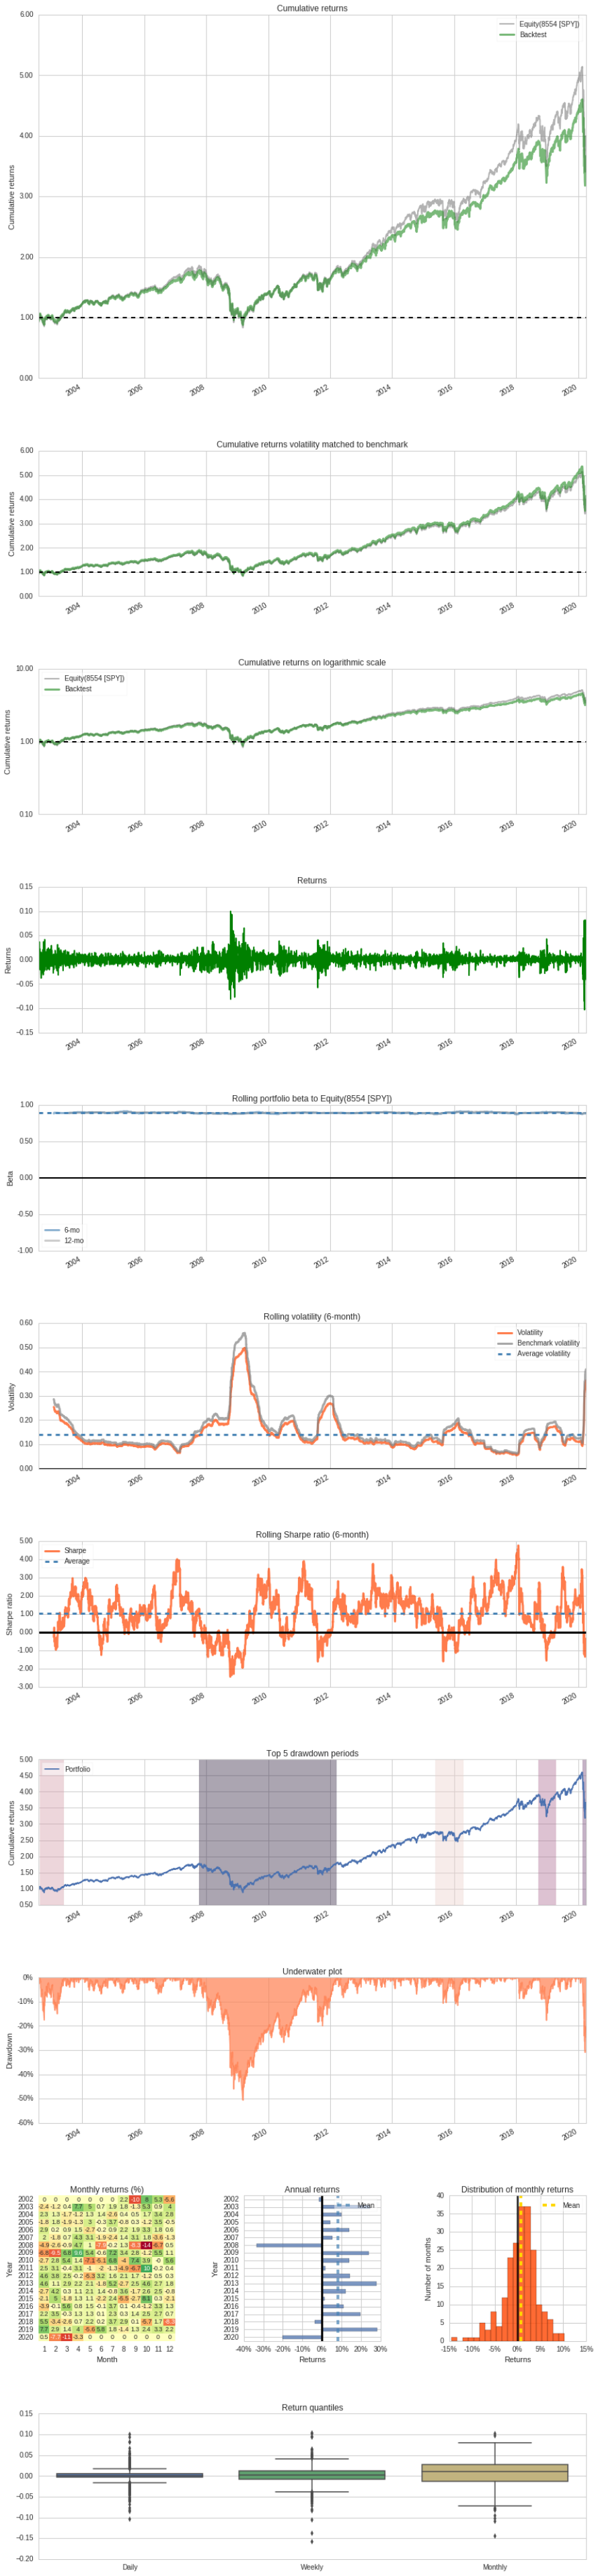
Quantopian algorithm backtesting platform has provided a summary of the performance.
| Annual return | 7.348% |
| Cumulative returns | 249.77% |
| Annual volatility | 17.128% |
| Sharpe ratio | 0.50 |
| Calmar ratio | 0.15 |
| Stability | 0.88 |
| Max drawdown | -50.666% |
| Omega ratio | 1.10 |
| Sortino ratio | 0.70 |
| Skew | -0.23 |
| Kurtosis | 12.36 |
| Tail ratio | 0.92 |
| Daily value at risk | -2.124% |
| Gross leverage | 1.00 |
| Daily turnover | 0.077% |
| Alpha | 0.00 |
| Beta | 0.89 |
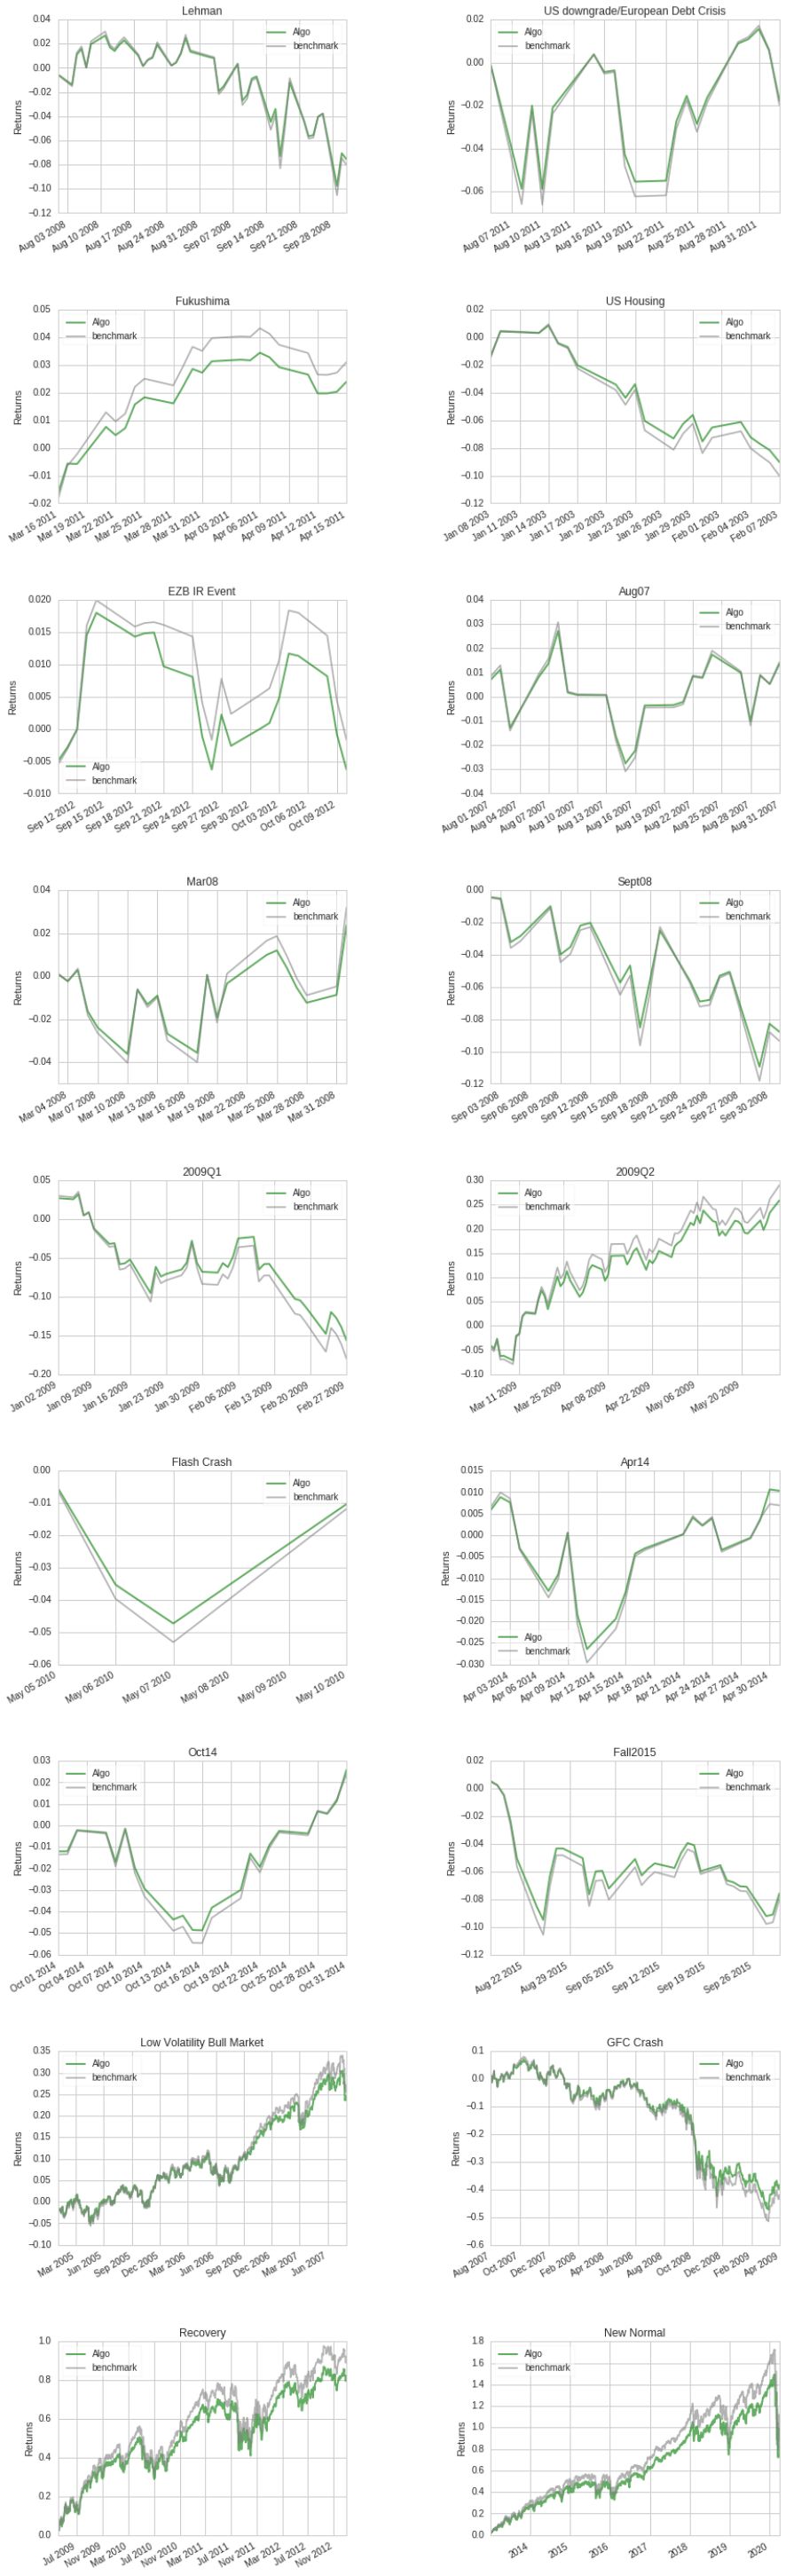
The portfolio’s returns during different time periods or events are summarized below.
| Stress Events | mean | min | max |
|---|---|---|---|
| Lehman | -0.16% | -6.20% | 3.24% |
| US downgrade/European Debt Crisis | -0.05% | -5.76% | 4.11% |
| Fukushima | 0.10% | -1.67% | 1.35% |
| US Housing | -0.42% | -2.75% | 1.76% |
| EZB IR Event | -0.03% | -0.91% | 1.46% |
| Aug07 | 0.07% | -2.49% | 2.13% |
| Mar08 | 0.12% | -1.98% | 3.76% |
| Sept08 | -0.39% | -6.20% | 3.24% |
| 2009Q1 | -0.42% | -4.58% | 3.75% |
| 2009Q2 | 0.38% | -4.10% | 6.56% |
| Flash Crash | -0.23% | -3.01% | 3.88% |
| Apr14 | 0.05% | -1.90% | 0.98% |
| Oct14 | 0.12% | -1.81% | 1.75% |
| Fall2015 | -0.23% | -3.65% | 3.47% |
| Low Volatility Bull Market | 0.04% | -3.20% | 1.94% |
| GFC Crash | -0.09% | -8.14% | 10.02% |
| Recovery | 0.07% | -5.76% | 4.11% |
| New Normal | 0.04% | -10.33% | 8.22% |
Below shows an overall summary of the performance over the entire period.
It seems that 10% in T-Bills is not benefiting the overall portfolio performance. I am guessing the 10% may act as an emergency fund for a family during a rainy day.
Resources used: Asset_allocation_portfolio_backtesting_python_script