
In this series, I am going to explore several asset allocation portfolio. Particularly, I am going to study Browne’s Permanent Portfolio.
| Asset type | Asset class | Proportion |
|---|---|---|
| US Large Cap | Stocks | 0.25 |
| US Small Cap | Stocks | 0 |
| Foreign Developed | Stocks | 0 |
| Foreign Emerging | Stocks | 0 |
| Corporate Bonds | Stocks or Bonds | 0 |
| T-Bills | Bonds | 0.25 |
| 10-year Bonds | Bonds | 0 |
| 20-year Bonds | Bonds | 0.25 |
| 10-year Foreign Bonds | Bonds | 0 |
| TIPS | Real Assets | 0 |
| Commodities | Real Assets | 0 |
| Gold | Real Assets | 0.25 |
| REITs | Real Assets | 0 |
I used SPY to represent US large cap, IEF to represent 20 year bond even though it is a baskets of 7-10 years maturity treasury bonds, TLT to represents T-bills and IAU to represent gold
I ran the backtest from the 1st of February 2005 to the 3rd of April 2020. The start date is determined by the availability of the IAU.
Quantopian algorithm backtesting platform has provided a summary of the performance.
| Annual return | 7.442% |
| Cumulative returns | 196.88% |
| Annual volatility | 7.493% |
| Sharpe ratio | 1.00 |
| Calmar ratio | 0.46 |
| Stability | 0.96 |
| Max drawdown | -16.168% |
| Omega ratio | 1.19 |
| Sortino ratio | 1.44 |
| Skew | -0.17 |
| Kurtosis | 4.93 |
| Tail ratio | 1.00 |
| Daily value at risk | -0.914% |
| Gross leverage | 0.99 |
| Daily turnover | 0.182% |
| Alpha | 0.06 |
| Beta | 0.13 |
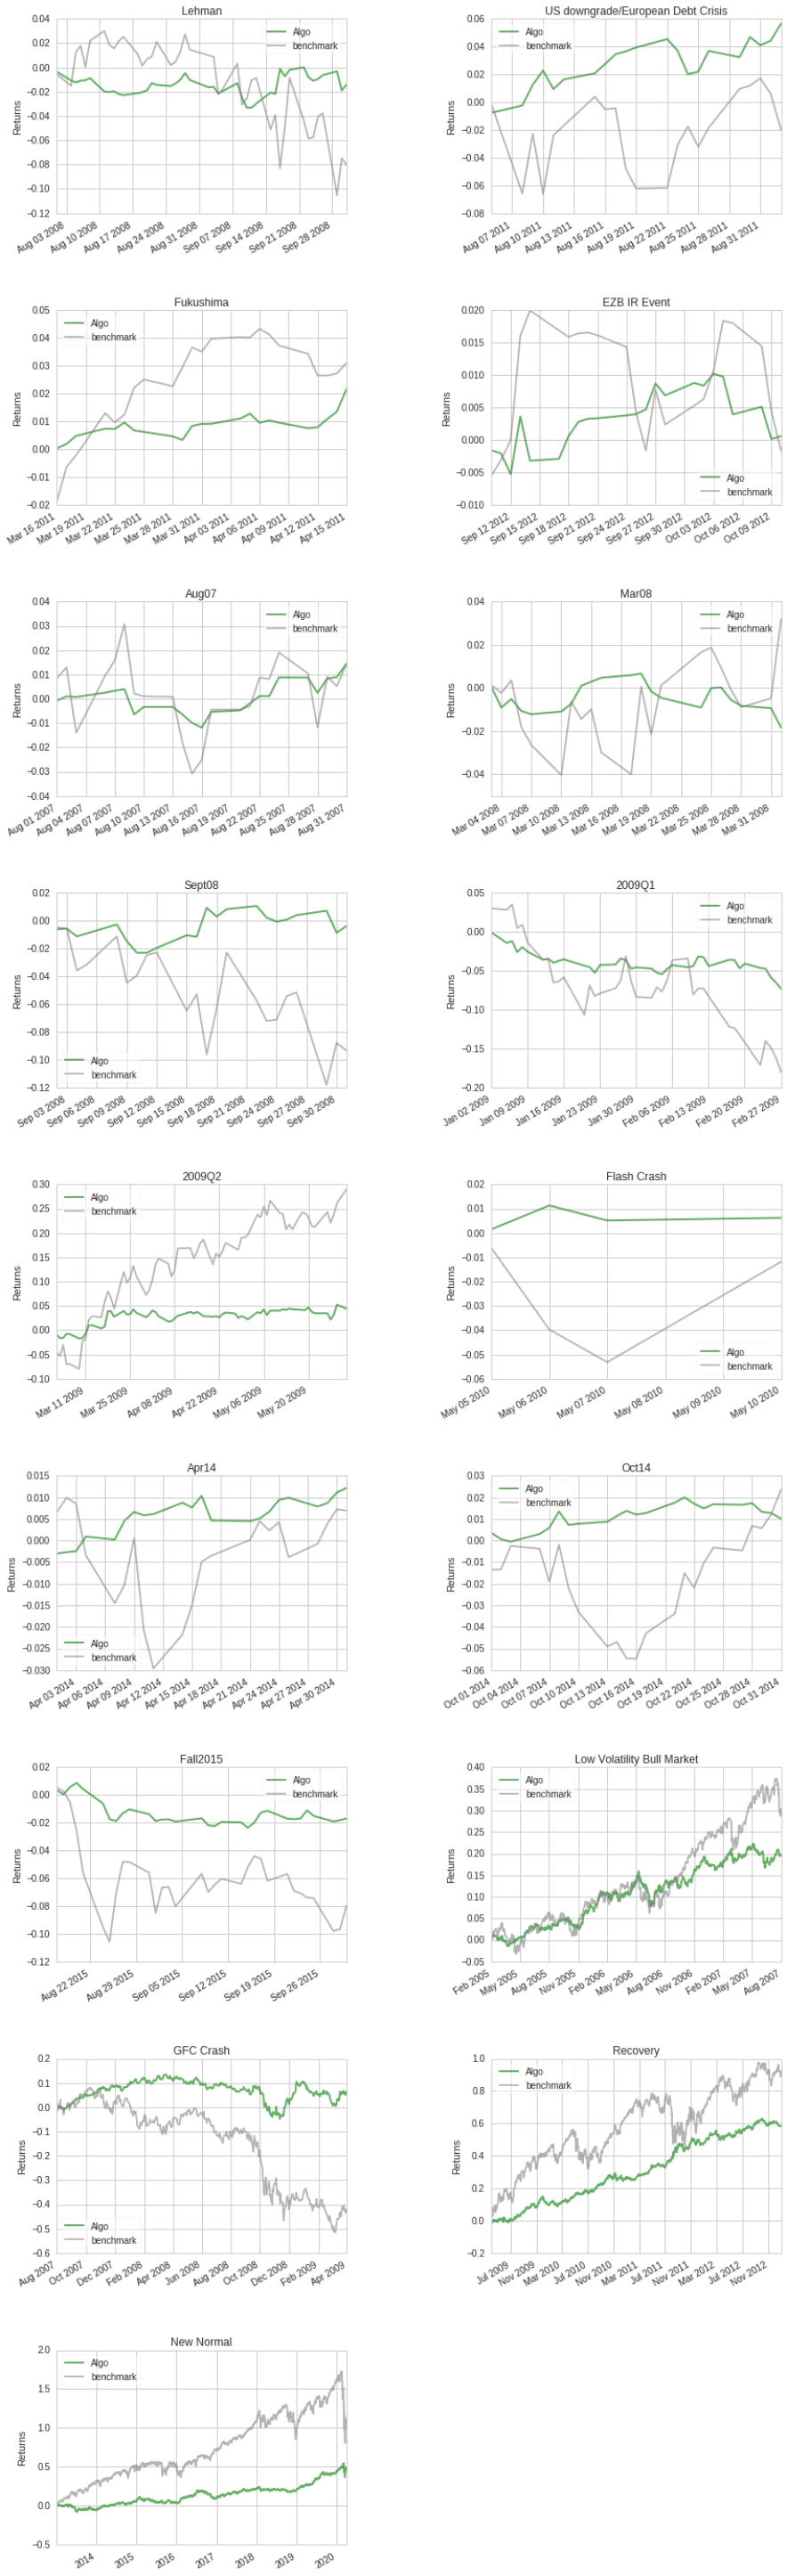
The portfolio’s returns during different time periods or events are summarized below.
| Stress Events | mean | min | max |
|---|---|---|---|
| Lehman | -0.03% | -1.58% | 2.12% |
| US downgrade/European Debt Crisis | 0.27% | -1.63% | 1.50% |
| Fukushima | 0.09% | -0.33% | 0.80% |
| EZB IR Event | 0.00% | -0.68% | 0.90% |
| Aug07 | 0.06% | -1.03% | 0.77% |
| Mar08 | -0.09% | -0.97% | 0.91% |
| Sept08 | -0.01% | -1.58% | 2.12% |
| 2009Q1 | -0.19% | -1.43% | 1.29% |
| 2009Q2 | 0.07% | -1.24% | 3.19% |
| Flash Crash | 0.16% | -0.61% | 0.98% |
| Apr14 | 0.06% | -0.56% | 0.44% |
| Oct14 | 0.04% | -0.61% | 0.75% |
| Fall2015 | -0.05% | -1.14% | 0.73% |
| Low Volatility Bull Market | 0.03% | -1.83% | 1.58% |
| GFC Crash | 0.02% | -2.76% | 3.22% |
| Recovery | 0.05% | -1.88% | 1.99% |
| New Normal | 0.02% | -3.45% | 2.43% |
Below shows an overall summary of the performance over the entire period.
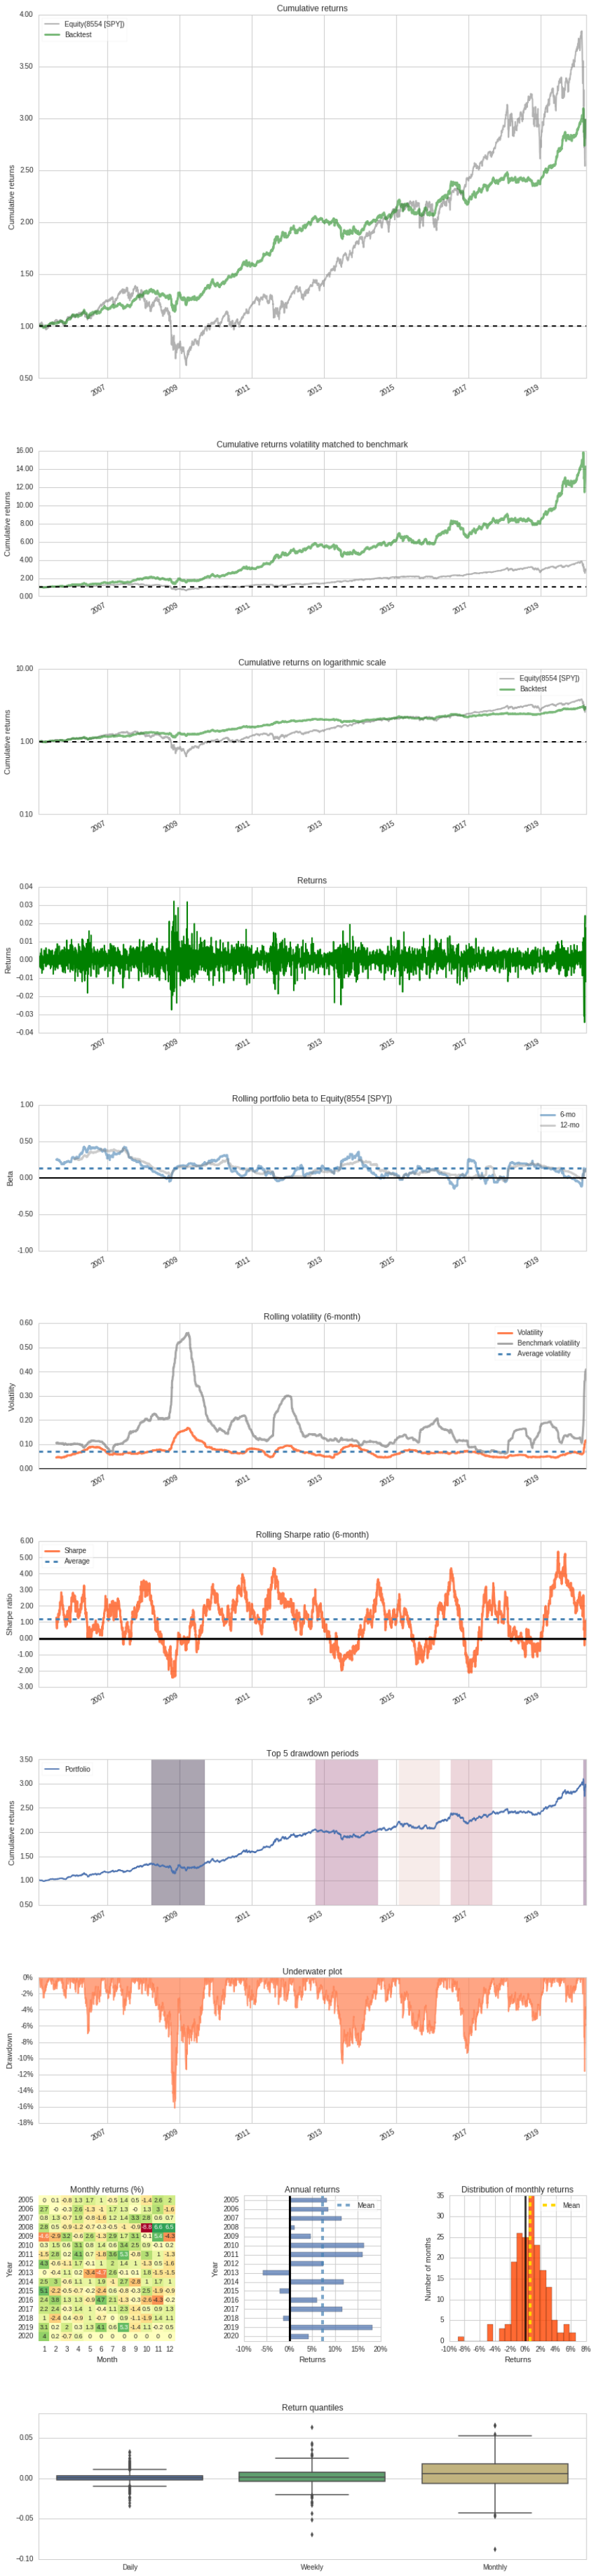
During New Normal, we have seen a very strong and long bull market, shown by the high rate of returns of the US equities. This portfolio which has a descent portion of fund allocated to stocks could not keep pace with returns of the US stock market. However, I still believe that diversification, to some extent, is still a good strategy during other times over the testing period.
Resources used: Asset_allocation_portfolio_backtesting_python_script